1.8.1. Consolidation from trace files
Computing a consolidated coverage result from multiple executions is simply achieved by providing the set of trace files resulting for these executions as inputs to a single gnatcov coverage command.
The set of traces involved in a computation, with some details about each
trace (file name, timestamp, tag), is visible in the index page of html
reports and in the Assessment Context section of =report outputs,
where the command line is quoted.
Trace consolidation works the same for source or binary traces. Mixing binary and source traces is not supported, however, so all the traces provided for a consolidation must be of the same kind (all source or all binary).
The following subsections provide examples of possible use cases of this facility.
1.8.1.1. Single unit tested by different programs
We will first consider achieving statement coverage of the following example Ada unit, which implements part of a robot controller able to send actuator commands depending on what a front sensor perceives is ahead of the robot:
package Commands is

   type Command is (Step, Hold);
   type Perceived is (Ground, Rock, Pit);

   function Safe (Cmd : Command; Front : Perceived) return Boolean;
   --  Whether executing CMD is safe with FRONT perceived ahead

   N_Safe, N_Unsafe : Integer := 0;
   --  Count the number of safe/unsafe cases we have evaluated
end Commands;

package body Commands is

   procedure Stat (Safe : Boolean) is
   begin
      if Safe then
         N_Safe := N_Safe + 1;
      else
         N_Unsafe := N_Unsafe + 1;
      end if;
   end Stat;

   function Safe (Cmd : Command; Front : Perceived) return Boolean is

      --  Standing straight is always safe, and any other action is
      --  safe as soon as there is just solid ground ahead:
      Result : constant Boolean := Cmd = Hold or else Front = Ground;
   begin
      Stat (Result);
      return Result;
   end Safe;
end Commands;
We exercise the Commands body by combining two sorts of tests. The first
one exercises safe commands only:
procedure Test_Cmd_Safe is
begin
   --  Remaining still is always safe, as is stepping with room ahead:
   Assert (Safe (Cmd => Hold, Front => Rock));
   Assert (Safe (Cmd => Hold, Front => Pit));
   Assert (Safe (Cmd => Step, Front => Ground));
end Test_Cmd_Safe;
The second one exercises unsafe commands only:
procedure Test_Cmd_Unsafe is
begin
   --  Stepping forward without room ahead is always unsafe
   Assert (not Safe (Cmd => Step, Front => Rock));
   Assert (not Safe (Cmd => Step, Front => Pit));
end Test_Cmd_Unsafe;
If we were to produce a coverage report for each individual test, we would observe partial coverage of the Commands body regardless of the kind of trace used.
Indeed, an =xcov report from the first test only would typically
display:
 6 .:    procedure Stat (Safe : Boolean) is
 7 .:    begin
 8 +:       if Safe then
 9 +:          N_Safe := N_Safe + 1;
10 .:       else
11 -:          N_Unsafe := N_Unsafe + 1;
12 .:       end if;
13 .:    end Stat;
Where, in accordance with the testcase strategy, everything is statement covered except the code specific to unsafe situations, here the counter update on line 11.
Conversely, an =xcov report from the second test only would
yield the symmetric results:
 6 .:    procedure Stat (Safe : Boolean) is
 7 .:    begin
 8 +:       if Safe then
 9 -:          N_Safe := N_Safe + 1;
10 .:       else
11 +:          N_Unsafe := N_Unsafe + 1;
12 .:       end if;
13 .:    end Stat;
Then a report obtained by combining traces, binary or source, will show achievement of complete statement coverage like so:
 6 .:    procedure Stat (Safe : Boolean) is
 7 .:    begin
 8 +:       if Safe then
 9 +:          N_Safe := N_Safe + 1;
10 .:       else
11 +:          N_Unsafe := N_Unsafe + 1;
12 .:       end if;
13 .:    end Stat;
Assuming you have obtained one trace for the execution of each test, both traces either source or binary, the command to produce the combined report would be something like:
gnatcov coverage --level=stmt <units-of-interest> --annotate=xcov
  test_cmd_safe.trace test_cmd_unsafe.trace
The means to obtain the traces and the <units-of-interest> switches
would depend on how the functional and testing code has been organized.
One possibility would be to have all the code hosted by a single project where we could explicitly state which units are of interest, for example:
project Example1 is
  for Source_Dirs use ("code", "tests");

  -- Test drivers
  for Main use ("test_cmd_safe.adb", "test_cmd_unsafe.adb");

  -- State subset of units of interest to coverage analysis
  package Coverage is
    for Units use ("commands");
  end Coverage;
end Example1;
Another possibility would be to have a separate project for each family of units (code or tests), possibly a library project for the code part, or whatever else suits your build and testing environment best.
In this example, consolidation involved different programs with partial code overlap, as depicted on the following representation:
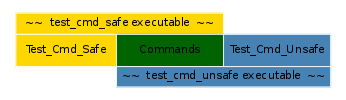
Fig. 1.9 Overlapping executables
Consolidation actually doesn’t require overlapping: users might well, for example, consolidate results from different programs testing entirely disjoint sets of units. A typical situation where this would happen is when testing independent units of a library, as illustrated by the following example.
1.8.1.2. Disjoint units tested by different programs
Let us consider an example library composed of the following two Ada
procedures, implemented in separate source files inc.adb and mult.adb:
procedure Inc (X : in out Integer; Amount : Integer) is   -- inc.adb
begin
   X := X + Amount;
end;

procedure Mult (X : in out Integer; Amount : Integer) is  -- mult.adb
begin
   X := X * Amount;
end;
We write two different programs to test the code from inc.adb on the one hand and the code from mult.adb on the other hand:
with Inc, Assert;     -- test_inc.adb
procedure Test_Inc is
   X : Integer := 0;
begin
   Inc (X, 1);
   Assert (X = 1);
end;

with Mult, Assert;    -- test_mult.adb
procedure Test_Mult is
   X : Integer := 2;
begin
   Mult (X, 2);
   Assert (X = 4);
end;
Here as well, assuming you have obtained one trace for the execution of each
test, assessing the library statement coverage achieved by test_inc alone,
as a violations report, would go as:
gnatcov coverage --level=stmt --annotate=report
   <units-of-interest> test_inc.trace
There is no reference to the mult unit at all in the test and all the
associated statements are marked uncovered in this case, this would yield:
2.1. STMT COVERAGE
------------------

mult.adb:3:4: statement not executed

1 violation.
Proper coverage of the library units is achieved by the two unit tests, which we can see by requesting the consolidated coverage achieved by the two executions:
gnatcov coverage --level=stmt --annotate=report
   <units-of-interest> test_inc.trace test_mult.trace

 ...
 2.1. STMT COVERAGE
 ------------------

 No violation.
1.8.1.3. Multiple executions of a single program
Consider the example C program below, offering a simple command line interface
to perform very basic math operations. This is splitted in two main source
files: process.c doing the computation and displaying the result, and
main.c for the main entry point and basic usage control:
#include <stdio.h>        /* main.c */
#include <assert.h>
#include "process.h"

void usage ()
{
  printf ("calc <int1> <int2> <op>, print result of <int1> <op> <int2>\n");
}

int main (int argc, const char * argv[])
{
  if (argc != 4)
    {
      usage ();
      exit (1);
    }

  process (argv);
  return 0;
}
#include <stdio.h>        /* process.c */
#include <assert.h>
#include "process.h"

void process (const char * argv[])
{
  int x = atoi (argv[1]), y = atoi (argv[2]);
  char opcode = argv[3][0];

  int result;

  switch (opcode)
    {
    case '*':
      result = x * y;
      break;
    case '+':
      result = x + y;
      break;
    default:
      printf ("unsupported opcode %c\n", opcode);
      return;
    }

  printf ("%d %c %d = %d\n", x, opcode, y, result);
}
#ifndef __PROCESS_H__     /* process.h */
#define __PROCESS_H__
extern void process (const char * argv[]);
#endif
Assuming an instrumented version of the program was built, here is a sequence of executions for various use cases, producing source traces on a native system and controlling the trace name by way of our dedicated environment variable:
GNATCOV_TRACE_FILE=mult.srctrace ./calc 6 5 '*'
GNATCOV_TRACE_FILE=plus.srctrace ./calc 2 3 '+'
GNATCOV_TRACE_FILE=div.srctrace  ./calc 2 3 '/'
GNATCOV_TRACE_FILE=misuse.srctrace ./calc
Now we can use gnatcov coverage to assess the coverage achieved by arbitrary
combinations of the executions, just by passing the corresponding traces.
For example, combining the two executions exercising the * and +
computations for statement coverage can be achieved with:
gnatcov coverage --scos=main.c.gli --scos=process.c.gli \
   --annotate=xcov --level=stmt mult.srctrace plus.srctrace
And this yields reports in main.c.xcov and process.c.xcov like:
 ...
 5 .: void usage ()
 6 .: {
 7 -:   printf ("calc <i1> <i2> <op>, print result of <i1> <op> <i2>\n");
 8 .: }
 9 .:
10 .: int main (int argc, const char * argv[])
11 .: {
12 +:   if (argc != 4)
13 .:     {
14 -:       usage ();
15 -:       exit (1);
16 .:     }
17 .:
18 +:   process (argv);
19 +:   return 0;
20 .: }

 ...
 5 .: void process (const char * argv[])
 6 .: {
 7 +:   int x = atoi (argv[1]), y = atoi (argv[2]);
 8 +:   char opcode = argv[3][0];
 9 .:
10 +:   int result;
11 .:
12 +:   switch (opcode)
13 .:     {
14 .:     case '*':
15 +:       result = x * y;
16 +:       break;
17 .:     case '+':
18 +:       result = x + y;
19 +:       break;
20 .:     default:
21 -:       printf ("unsupported opcode %c\n", opcode);
22 -:       return;
23 .:     }
24 .:
25 +:   printf ("%d %c %d = %d\n", x, opcode, y, result);
26 .: }
We observe a reported absence of coverage for statements corresponding to the
treatment of two kinds of usage error: wrong number of command line arguments,
visible on lines 7, 14, and 15 of main.c, and attempt to compute an
unsupported operation, visible on lines 21 and 22 of process.c. These two
scenarios, exercised through div.srctrace and misuse.srctrace were
indeed not included in the consolidation scope.
1.8.1.4. Special care needed with binary traces
1.8.1.4.1. Control of inlining in test programs
With binary traces, the program is not itself instrumented to collect coverage information on its own and the object files used to assess coverage are more likely (than with source traces) to be used directly in operational conditions. In such cases, we want to make sure that the binary code from those object files is indeed exercised during the testing campaign.
While this would automatically be the case for integration testing campaigns, campaigns based on the use of explicit testing code, such as unit tests, need to make sure that calls into the code-under-test by the testing code are not inlined by the compiler.
With GCC based toolchains such as GNAT Pro, this can be achieved by adding
-fno-inline to the compilation options of the testing code.
1.8.1.4.2. Object code overlap in executables
For object or source level criteria, gnatcov computes the coverage achieved for the full set of routines or source units declared to be of interest amongst those exposed by the union of the exercised executables, as designated by the set of consolidated traces;
For the purpose of computing combined coverage achievements, two symbols are considered overlapping when all the following conditions are met:
Both symbols have identical names at the object level,
Both symbols have DWARF debug information attached to them,
According to this debug information, both symbols originate from the same compilation unit, denoted by the full path of the corresponding source file.
By this construction, a symbol missing debug information is never considered
overlapping with any other symbol. Whatever coverage is achieved on such a
symbol never gets combined with anything else and the only kind of report
where the symbol coverage is exposed is the =asm assembly output for
object level criteria.
Moreover, for object level coverage criteria, gnatcov coverage will issue a consolidation error when two symbols are found to overlap but have structurally different machine code, which happens for example when the same unit is compiled with different different optimization levels for different executables.