1.12. Using GNATcoverage from GNAT Studio
GNATcoverage is integrated in GNAT Studio so that it is possible to analyze code coverage without leaving your favorite editor.
1.12.1. Basic usage
As a first step, indicate which coverage criterion GNATcoverage should use. The default is stmt. For this, go to the project properties ().
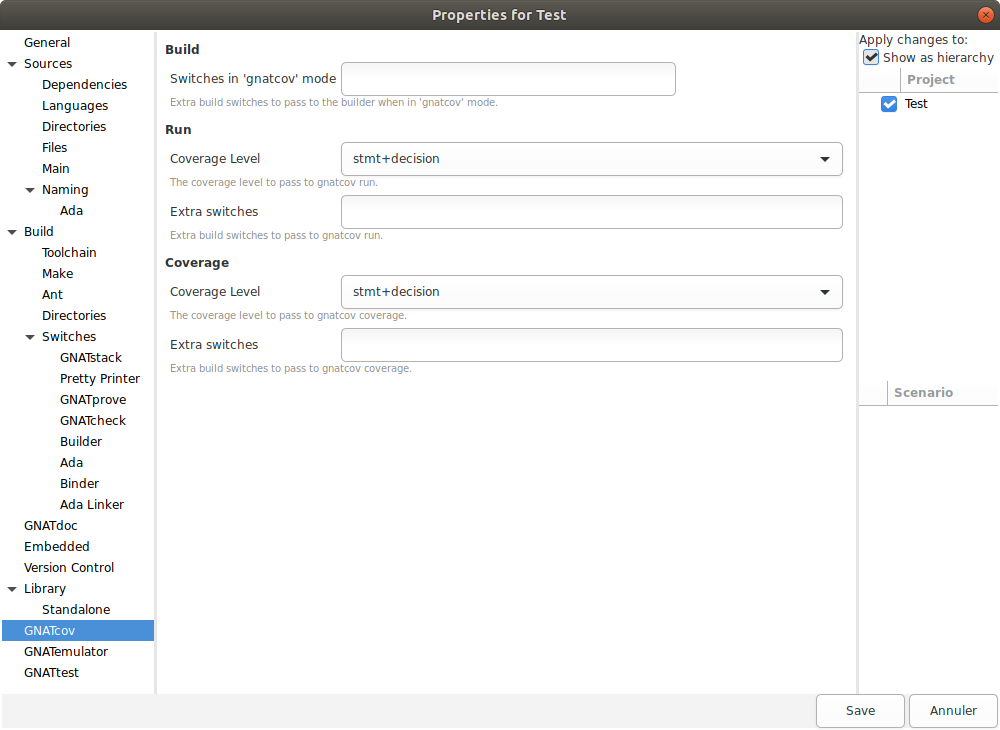
In the GNATcov entry, you can change the coverage level passed to gnatcov commands
in the corresponding Coverage level combo boxes. Change both to
stmt+decision.
This is all for the setup part. Then you just need to click on the Run GNATcoverage toolbar button as shown in the following screenshot.
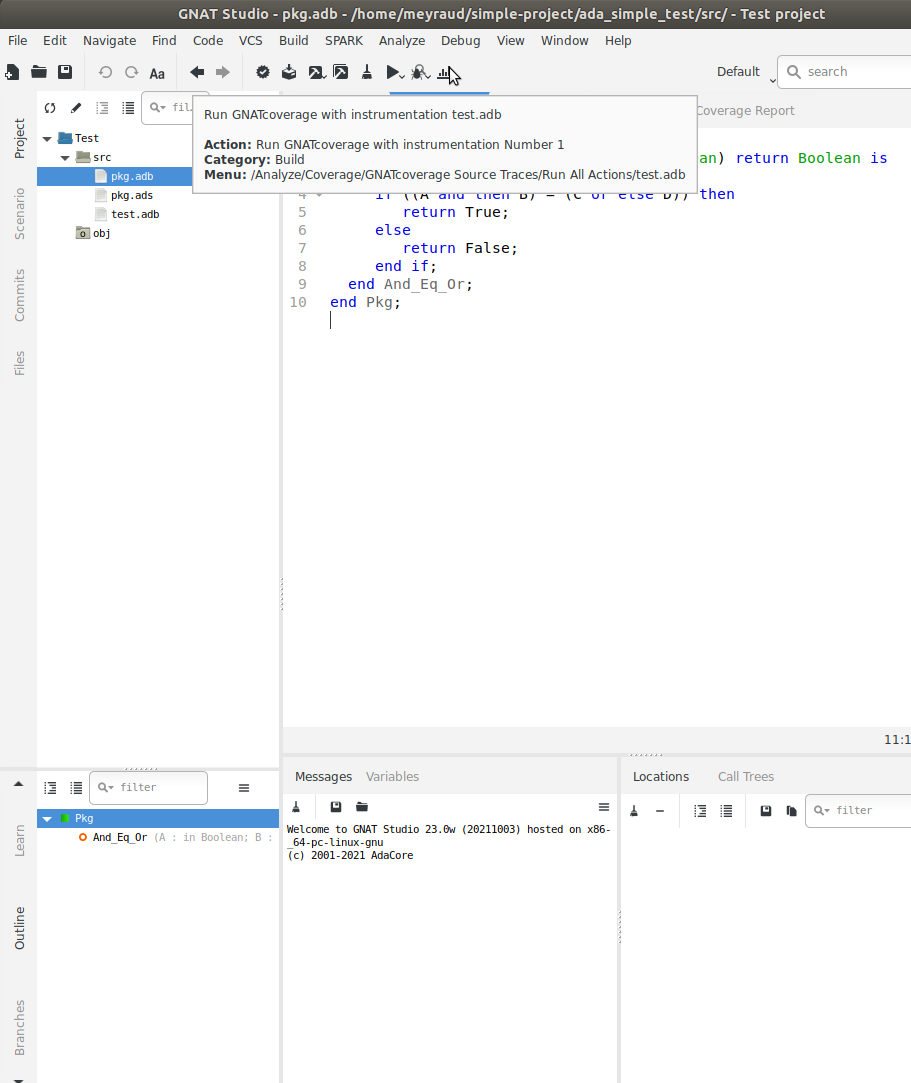
This button uses GNATcoverage instrumentation capabilities by default. It will perform each needed step: build the GNATcoverage runtime, instrument your project, build the instrumented version of it, run the instrumented program, and display a Coverage Report view which displays the ratio of source lines that are covered.
Note that each step can be performed individually by clicking on their respective menu items under the .
Also Note that you can select a prebuilt gnatcov runtime under the same menu. This will skip the “build the gnatcov runtime” step, and will be especially useful if you bring modifications to this runtime. By default, GNATstudio will rebuild the runtime that is shipped with GNATcoverage and reinstall it in a temporary directory every time.
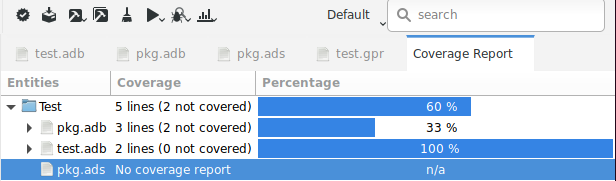
In order to read the detail of which line is covered and which line is not, double-click on the file you want to inspect. This will open an editor on the file with annotations that represent the coverage state:
red annotations for uncovered ones;
orange annotations for partially covered ones;
green annotations for covered ones.
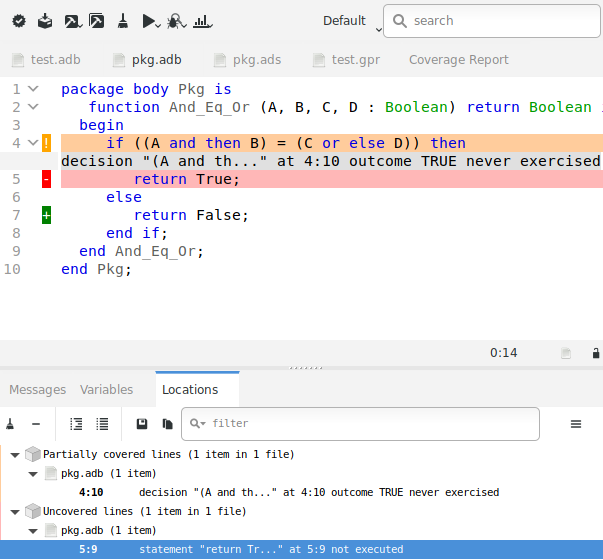
Note that the Locations view reports all non-covered lines. It makes navigation easy as you only have to click on a diagnostic to go to the corresponding line.
1.12.2. Binary traces usage
Starting from GNATcoverage version 22.0, binary traces (using gnatcov run) are no longer supported in native profiles. This mode is still supported for cross configurations so the same steps performed above for source traces can be done for binary traces IF you are in a supported configuration (otherwise, the menu items won’t show up).
Go to the menu
.
to perform each step individually, or use the Run All Actions item.
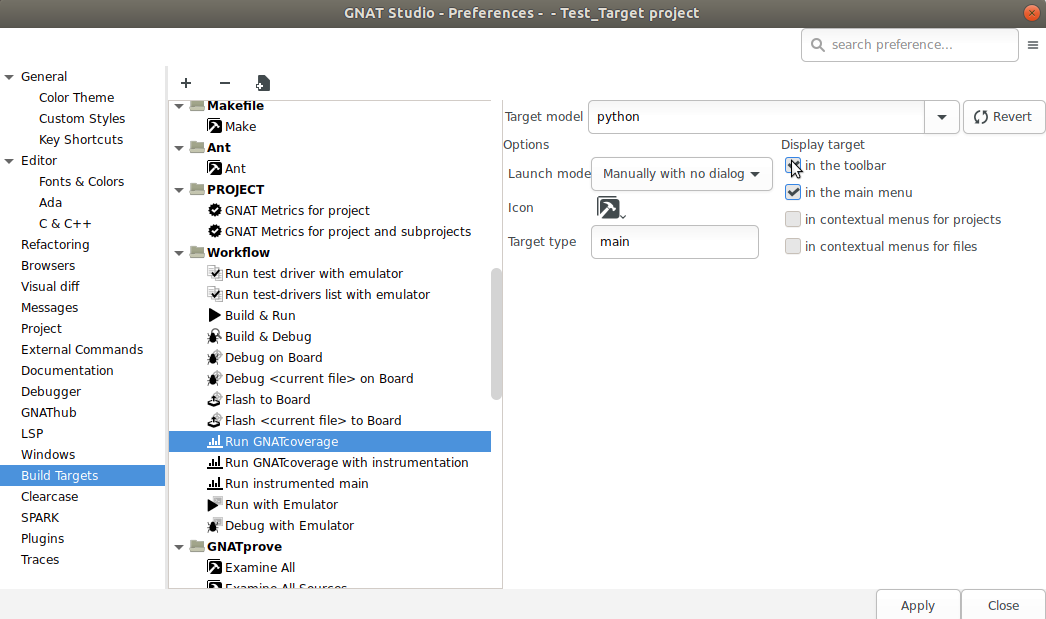
You can also replace the toolbar button (dedicated to the instrumentation-based scheme) with an alike button, but for binary traces. Go to GNATstudio Preferences in .
Then, go to the Build Targets section, and find the Run GNATcoverage
workflow: add it to the toolbar as shown below.
Remove from the toolbar the Run GNATcoverage with instrumentation in the
same fashion.
1.12.3. GNATtest scenario
Using GNATcoverage GNATtest-based testsuite in GNAT Studio comes naturally as the combination of both. Open the project you want to test and then generate the unit test setup for it. Using the menu: .
Write your testcases, and when you are ready to run your testsuite, switch to
the gnatcov build mode, select the desired coverage criteria in the project
properties. Now, click on the Run GNATcoverage toolbar button.
Depending on your version of GNATcoverage, logs in the Messages view might include warnings which mention the various helper projects generated and used by the GNATtest setup, for instance AUnit. These should not influence coverage analysis results for the units of your project.