1.1. Getting Started
1.1.1. Framework concepts and process overview
GNATcoverage provides a range of coverage analysis facilities with support notably for
A variety of measurement methods, coverage criteria and output formats;
Powerful consolidation features to report about the combined achievements of multiple program executions.
Actual coverage is always first computed out of trace files conveying what test programs have achieved. GNATcoverage works with two possible kinds of traces:
Binary traces, produced by an instrumented execution environment while running an unmodifed version of the program. Such traces contain low level information about executed blocks of machine instructions.
Source traces, produced by an alternative version of the program, built from sources instrumented to feed coverage dedicated datastructures.
Both kinds of traces can be used to assess so called source coverage criteria, where the entities subject to coverage assessment are defined in terms of source level constructs. The specific criteria that GNATcoverage supports are those defined by the DO-178B certification standard for civil avionics:
Statement Coverage, where the coverage metrics are respective to source level statements such as a variable assignment or a subprogram calls;
Decision Coverage, which, in addition to statement coverage, requires evaluating Boolean expressions (decisions in DO178B parlance) both True and False, then
Modified Condition/Decision Coverage, commonly known as MCDC, which requires testing particular variations of individual Boolean operands (conditions in DO178B parlance) within decisions.
From binary traces, GNATcoverage is also able to produce object coverage reports, measuring the coverage of machine level instructions produced by the compilation toolchain out of the original sources. GNATcoverage supports two criteria of this kind:
Instruction Coverage, where we evaluate for each machine instruction whether it has been executed at least once or not; and
Branch Coverage, where, in addition, we evaluate for each conditional branch instruction whether it was only taken, or went fallthrough or both.
A central notion to all the assessments performed with GNATcoverage is that of units of interest, which simply designates the set of compilation units of which we are aiming to assess the coverage. These typically include the code under test in a campaign, as opposed to, for example, the sources of the test harness infrastructure when one is used. The individual statements, decisions, or conditions of relevance within units of interest are referred to as Source Coverage Obligations or SCOs.
Consolidation can be performed by aggregating multiple traces directly, or so called Coverage Checkpoints, which are just an internal representation of partial coverage results.
The high level processes involved in using binary or source traces are sketched on Fig. 1.1. We don’t support mixing the two kinds of traces together and have depicted a separate analysis/consolidation step to emphasize this.
We have however strived to maximize the commonalities between the two schemes, as hinted by the use of the same blue color for the common notions and analysis steps. Indeed, the command line interfaces involved are the same, they use inputs of similar general nature (traces or checkpoints) and share common definitions of available output formats for source coverage criteria. This is intended to facilitate transitions from one scheme to the other and ensure that the widest possible range of improvements benefit both modes in a consistent manner.
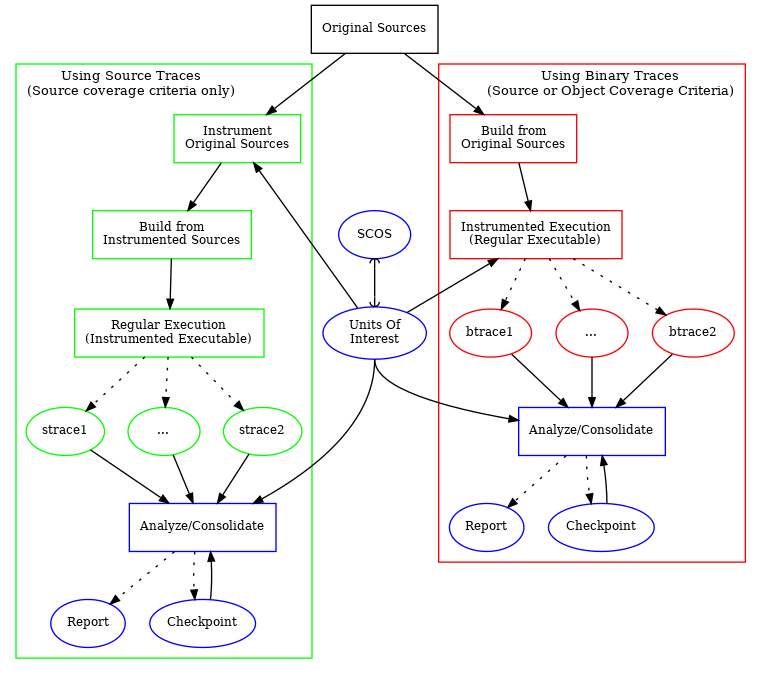
Fig. 1.1 Coverage analysis processes overview
1.1.2. Selecting a trace mode; supported features and environments
The source and binary trace modes each have specific strengths, the relative importance of which depends on the project context. The matrix below summarizes the main characteristics of each mode, as a first key to help select one scheme or the other for a given software development project:
With Source Traces |
With Binary Traces |
|
|---|---|---|
Tracing mechanism |
Program instrumentation |
Execution environment |
~ |
~ |
~ |
Native applications |
Yes (including shared-libraries) |
No |
Cross configurations with RTOS |
Yes |
No |
Bareboard configurations |
Yes |
Selectively (specific CPUs only, through GNATemulator or hardware probes) |
~ |
~ |
~ |
Object coverage analysis (language agnostic) |
No |
Yes |
Source coverage analysis for Ada (up to Ada 2012) |
Yes |
Yes |
Source coverage analysis for C |
Beta in release 22 |
Yes |
The source trace based workflow also has a few other limitations that are outlined in section gnatcov instrument limitations.
1.1.3. A brief introduction to the main process steps
This section is intended to illustrate the basics of the process on a very simple example, without getting into details.
We start from a very simple Ada package exposing a set of elementary
operations over Integer objects, with a spec and body in source files
named ops.ads and ops.adb:
-- ops.ads
package Ops is
  type Op_Kind is (Increment, Decrement);

  procedure Apply (Op : Op_Kind; X : in out Integer);
end;
-- ops.adb
package body Ops is
  procedure Apply (Op : Op_Kind; X : in out Integer) is
  begin
     case Op is
        when Increment => X := X + 1;
        when Decrement => X := X - 1;
     end case;
  end;
end;
We will analyse the statement coverage achieved by the sample unit
test driver below, in test_inc.adb, which exercises the
Increment operation only:
-- test_inc.adb
with Ops;
procedure Test_Inc is
  X : Integer := 4;
begin
  Ops.Apply (Ops.Increment, X);
  pragma Assert (X = 5);
end;
We will illustrate two basic use cases, one using binary traces produced by
GNATemulator for a cross target, and one using source traces for a native
environment.
Assuming we start from a temporary working directory, with the ops sources
in an opslib subdirectory and the test sources in a tests
subdirectory, we will rely for both cases on a couple of project files in the
common working directory:
-- code.gpr
project Code is
  for Source_Dirs use ("opslib");
  for Object_Dir use "obj-" & Project'Name;
end Code;
-- tests.gpr
with "code.gpr";

project Tests is
  for Source_Dirs use ("tests");
  for Object_Dir use "obj-" & Project'Name;

  for Main use ("test_inc.adb");
end Tests;
If you wish to experiment with both trace modes, you should start from separate working directories (one for each mode) to prevent possible intereferences of artifacts from one mode on the other.
1.1.3.1. Example production of a binary trace for a bareboard environment
For binary traces, gnatcov relies on an instrumented execution environment to produce the traces instead of having to instrument the program itself with extra code and data structures. For cross configurations, GNATemulator provides such an environment. Hardware probes may also be used, provided trace data is converted to the format gnatcov expects.
Programs are built from their original sources, only requiring the use
of -g -fpreserve-control-flow -fdump-scos compilation
options to generate coverage obligation lists and let us associate
execution traces to these obligations afterwards.
For our example use case here, we first use the GNAT Pro toolset for
powerpc-elf to build, using gprbuild as follows:
gprbuild --target=powerpc-elf --RTS=light-mpc8641 -Ptests.gpr
 -cargs -g -fpreserve-control-flow -fdump-scos
We pass the project file with -P, the required compilation flags
with -cargs and request the use of a light runtime library tailored
for the mpc8641 board.
The build command produces a test_inc executable in the object
subdirectory. To automate the execution of this program within GNATemulator
to produce a trace, we provide the gnatcov run command. For the use case
at hand, we would simply do:
gnatcov run --target=powerpc-elf obj-tests/test_inc
… which would produce a test_inc.trace binary trace file in the current
directory. By default, such a trace is amenable to statement and decision
coverage at most. If MCDC analysis is needed, --level=stmt+mcdc must be
passed to gnatcov run as well and we recommand also providing source coverage
obligations in this case.
1.1.3.2. Example production of a source trace for a native environment
The production of source traces is performed by an instrumented version of the program running in its regular execution environment. The coverage data is collected and output by the program itself. The output step is performed by a specific instrumentation of the program main unit, according to a user selectable policy.
The whole scheme requires the use of GPR project files. The code inserted by the instrumentation process relies on common types and subprograms provided by a coverage runtime library, distributed in source form with GNATcoverage. The first thing to do for a given project is then to setup this coverage runtime so it becomes available to the instrumented sources afterwards. This step is documented in the Setting up the coverage runtime library section of this manual.
Instrumenting a test main program together with its “code” dependency is then achieved by a gnatcov instrument command. For our example use case, this would be:
gnatcov instrument -Ptests.gpr --level=stmt
  --dump-trigger=atexit --dump-channel=bin-file
The --dump-channel=bin-file switch requests outputing coverage data
directly to a trace file and --dump-trigger=atexit instructs to perform
this operation as part of an execution termination handler, the simplest
option in native environments. --level=stmt states that we will want to
perform statement coverage analysis afterwards and -Ptests.gpr
specifies the root project for coverage obligations and the main unit(s) to
instrument.
After setting GPR_PROJECT_PATH to designate the directory where the
coverage runtime has been installed, building the instrumented program then
goes like:
gprbuild -f -p -Ptests.gpr
  --src-subdirs=gnatcov-instr --implicit-with=gnatcov_rts_full.gpr
The --src-subdirs and --implicit-with options respectively instruct
the builder to use the alternative sources produced by the instrumenter and to
automatically provide visiblity over the coverage runtime. This allows
building the instrumented version of the program without requiring any change
to the GPR project files.
Then simply executing the test program in its native environment, as in:
obj-tests/test_inc
produces a test_inc-<stamp>.srctrace source trace file in the
current directory. The -<stamp> suffix is intended to prevent
clashes in case of concurrent executions of the program in the same
directory. It can be controlled in a variety of ways from the
instrumentation command line, documented in the Controlling trace file names
section of this manual.
1.1.3.3. Example production of a coverage report
Analysis of the coverage achieved by previous executions is done with gnatcov coverage commands. For our example use case, this could for example be:
gnatcov coverage --level=stmt --annotate=xcov <trace> -Ptests.gpr
… where <trace> would be either the source or the binary trace produced
by the commands introduced in the previous example sections. Here, we request:
A source statement coverage assessment with
--level=stmt,An annotated source report in text format with
--annotate=xcov,For the complete set of units involved in the executable, per
-Ptests.gprand no specification otherwise in the project files.
This produces annotated sources in the project’s object directory,
with ops.adb.xcov quoted below:
examples/starter/src/ops.adb:
67% of 3 lines covered
Coverage level: stmt
 1 .: package body Ops is
 2 .:    procedure Apply (Op : Op_Kind; X : in out Integer) is
 3 .:    begin
 4 +:       case Op is
 5 +:          when Increment => X := X + 1;
 6 -:          when Decrement => X := X - 1;
 7 .:       end case;
 8 .:    end Apply;
 9 .: end Ops;
The analysis results are visible as + / - annotations on source lines,
next to the line numbers. The results we have here indicate proper coverage of
all the statements except the one dealing with a Decrement operation,
indeed never exercised by our driver.
The command actually also produces reports for ops.ads and
test_inc.adb, even though the latter is not really relevant. Focus on
specific units can be achieved by providing a more precise set of units of
interest at this stage. For source traces, this could also be incorporated as
part of the instrumentation step, as there is no point in instrumenting the
test units for their own coverage achievements.
1.1.4. Going Further
Each of the steps involved in the process overview presented previously is described in detail in a specific chapter of this manual, the most important ones referenced hereafter:
Coverage Exemptions is also worth noting here, a mechanism allowing users to define code regions for which coverage violations are expected and legitimate (Ada only at this stage).
1.1.5. Conventions used in the rest of this manual
A number of example commands include a
--level=<>switch, which conveys a target coverage criterion when needed.<>is a placeholder for an actual level supported by the tool in this case, such asstmt,stmt+decision, orstmt+mcdcfor source criteria.Example command lines might also include as
<units-of-interest>placeholder, which represents a set of switches conveying the set of units for interest for source coverage assessments. GPR project files provide the most elaborate mechanisms for this purpose and the Specifying Units Of Interest chapter describes all the available options.