1.12. Using GNATcoverage from GNAT Studio
GNATcoverage is integrated in GNAT Studio so that it is possible to analyze code coverage without leaving your favorite editor.
1.12.1. Basic scenario
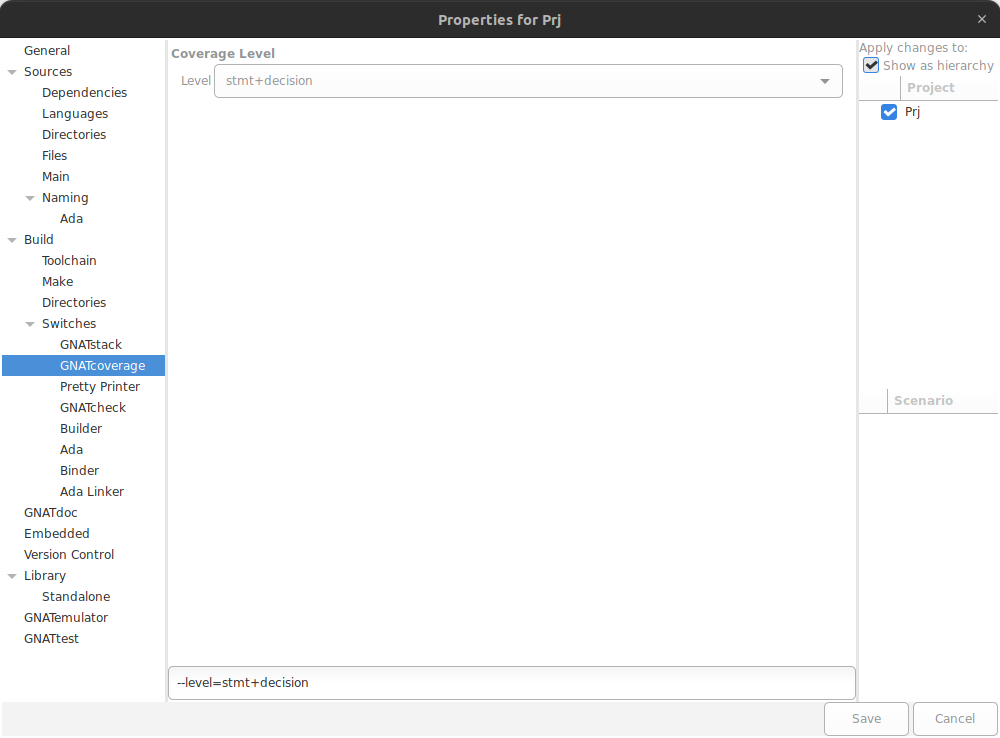
As a first step, indicate which coverage criterion GNATcoverage should use
through the project file. If no coverage level is set
in the project file, gnatcov will default to stmt, and emit a warning
indicating that the coverage level is not set.
You can specify the coverage level by by editing directly the project file: GNAT Studio
provides completion, tooltips, outline and other common IDE features for project
files through LSP and the Ada Language Server,
helping you to customize your project more easily.
This is all for the setup part. Then you just need to click on the Run GNATcoverage toolbar button as shown in the following screenshot.
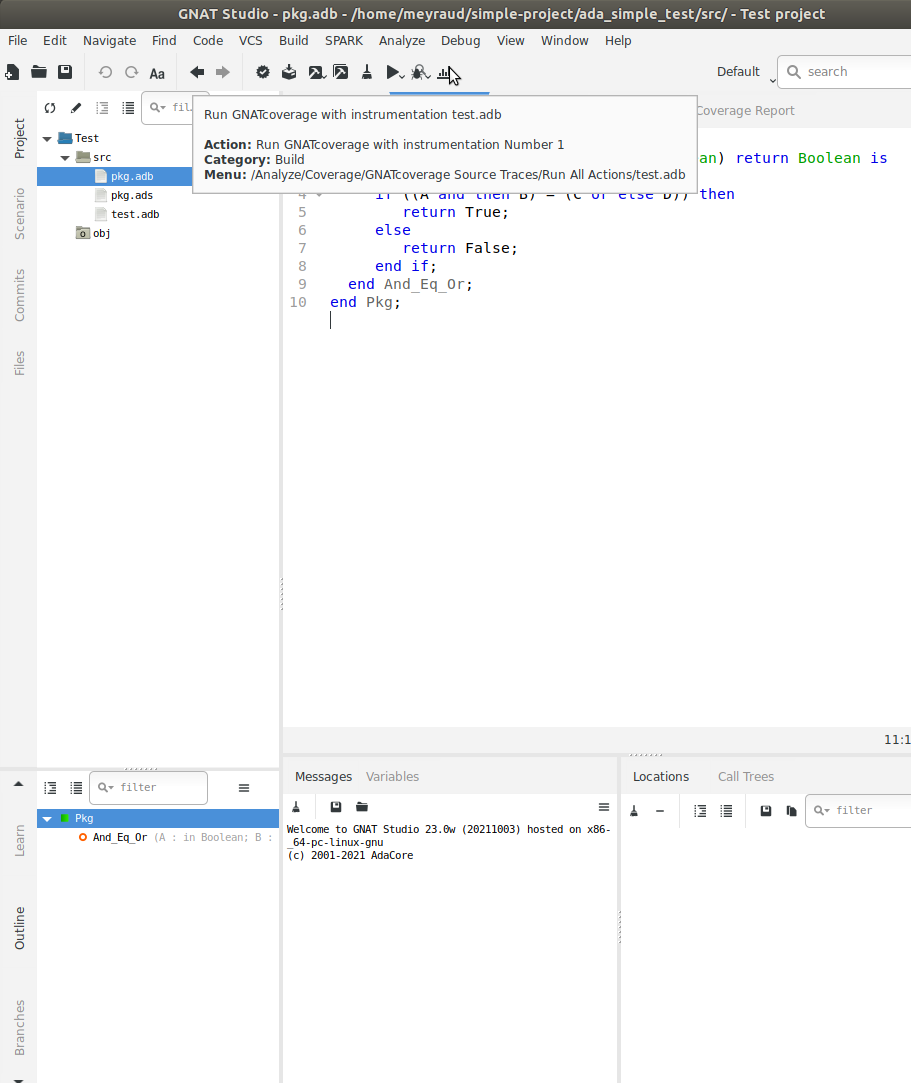
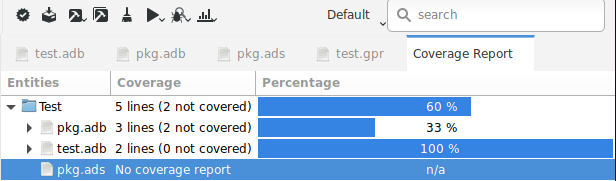
This button uses GNATcoverage instrumentation capabilities by default. It will perform each needed step: build the GNATcoverage runtime, instrument your project, build the instrumented version of it, run the instrumented program, and display a Coverage Report view which displays the ratio of source lines that are covered.
Note that each step can be performed individually by clicking on their respective menu items under the .
Also Note that you can select a prebuilt gnatcov runtime under the same menu. This will skip the “build the gnatcov runtime” step, and will be especially useful if you bring modifications to this runtime. By default, GNAT Studio will rebuild the runtime that is shipped with GNATcoverage and reinstall it in a temporary directory every time.
In order to read the detail of which line is covered and which line is not, double-click on the file you want to inspect. This will open an editor on the file with annotations that represent the coverage state:
red annotations for uncovered ones;
orange annotations for partially covered ones;
green annotations for covered ones.
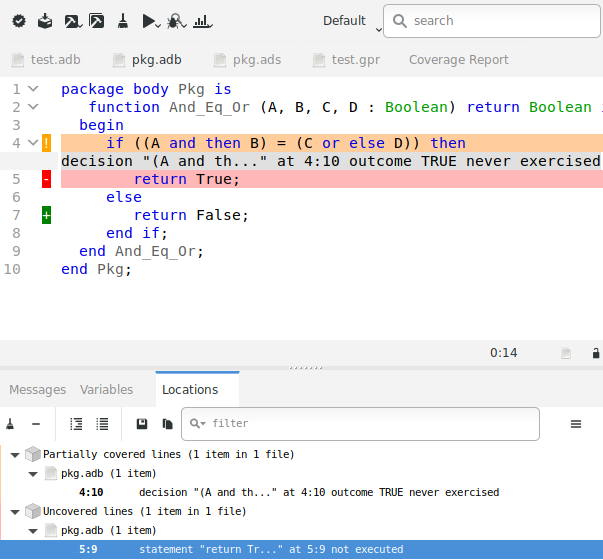
Note that the Locations view reports all non-covered lines. It makes navigation easy as you only have to click on a diagnostic to go to the corresponding line.
1.12.2. Viewing a coverage report produced outside of GNAT Studio
If the workflow is not adapted to your process, GNAT Studio also supports displaying a coverage report produced externally, by first loading the coverage data using any of the actionable Load Data item under .
GNAT Studio expects a coverage report under the xcov+ format, under the object directory of the project (<prj_obj>), or under <prj_obj>/xcov+.
Then you can visualize the report by clicking on .
1.12.3. Using GNATtest’s coverage integration makefile
When using individual test drivers, it is not possible to use the regular
GNATcoverage integration. This is true when GNATtest is called with
--separate-drivers or --stub (as it implies
--separate-drivers), as described in Individual Test
Drivers. In this case, the integration of
GNATcoverage is done through the use of the generated integration makefile. For
details on how to use this makefile, see Integration with
GNATcoverage.
Producing coverage reports through GNATtest’s coverage integration makefile generates the coverage reports under the test driver’s object director by default. However, these reports contain coverage information not for the test harness project, but for the project being tested with gnattest.
If the harness project is opened in GNAT Studio, the coverage data should be loaded using the actionable Load Data for All Projects item.
Visualization of the reports is then done as previously described.
1.12.4. GNATtest scenario
Using GNATcoverage GNATtest-based testsuite in GNAT Studio comes naturally as the combination of both. Open the project you want to test and then generate the unit test setup for it. Using the menu: .
Write your testcases, and when you are ready to run your testsuite, switch to
the gnatcov build mode, select the desired coverage criteria in the project
properties. Now, click on the Run GNATcoverage toolbar button.
Depending on your version of GNATcoverage, logs in the Messages view might include warnings which mention the various helper projects generated and used by the GNATtest setup, for instance AUnit. These should not influence coverage analysis results for the units of your project.