5. QGen Model Debugger
5.1. Requirements and installation
QGen Debugger is an add-on for QGen that relies on GNAT Studio to provide model debugging functionalities. Thus, before installing QGen Debugger, first proceed with the installation of GNAT Studio and QGen. See Installing QGen for more information about the installation of QGen.
The QGen Debugger package contains multiple tools including a compiler and a debugger that are not intended to be used independently from the QGen Debugger and are not supported outside of that usage.
To proceed with the installation of QGen Debugger, follow the same
instructions as for QGen in Installing QGen. Choose the QGen
installation folder $QGEN_INSTALL as the installation directory.
Then, to use QGen Debugger from your MATLAB environment, follow the setup process in Setting up QGen in MATLAB.
5.2. Create a Debugging session from Simulink
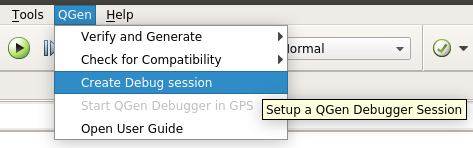
The easiest way to setup a debugging session is to use the project generation interface from Simulink. Open the model that you want to debug and click on QGen > Create Debug session.
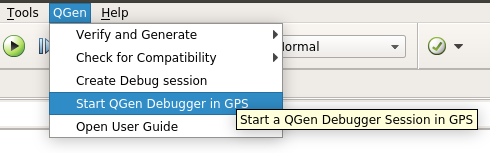
This will generate a simulation model sending values to the original model, referenced using a Model block. You can alter the values inside the inputs subsystem using any Simulink block or block combination. By default, a Signal Builder block is created within the subsystem that lets the user customize the inputs. Once you are satisfied click on QGen > Start QGen Debugger in {GPS|GNAT Studio}.
QGen will ask whether you want to use the simulation results or not.
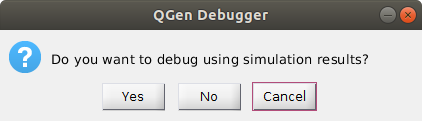
If you select Yes, simulation inputs and outputs data will be saved to a file located at:
<WORKING_DIR>/sim_<MODEL_NAME>/<MODEL_NAME>.output.sl.txtThis input data will then be used as input when debugging the model with QGen Debugger.
If you select No, the simulation data will not be exported and used by QGen.
The next popup will ask the user to select the output directory to export the model and the base workspace under the XMI format. Refer to Exporting the model information for more information.
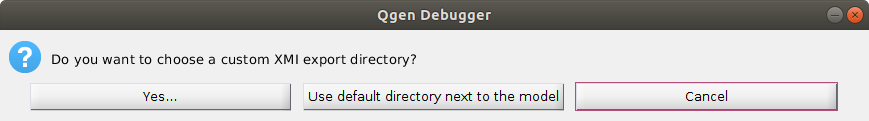
If you choose to use the default directory next to the model, QGen will create the following directory to store the XMIs:
<WORKING_DIR>/<MODEL_NAME>_qgen_dbg_xmi
When the export step is done, QGen will start GNAT Studio (or the older GPS if specified in the PATH) and open a new project running your model with the chosen values. After starting, GNAT Studio will ask you what language you want to generate code for.
A project will be automatically created and loaded, feel free to edit it with additional options if needed, see Setting up manually a Simulink project with GNAT Studio.
Once the project has been created once, you can launch GNAT Studio and load it manually without running MATLAB beforehand.
You can now jump to the Generating code and starting a debugging session section.
5.2.1. Recommended workflow
The first time to debug the model:
Follow the steps above to create the simulation model, log the simulation results, export the model, generate a debugging project and open it in GNAT Studio before finally debugging the model with QGen Debugger.
When the model has not changed:
If the model and its dependencies and the workspace have not changed, it is not necessary to repeat the above procedure. Instead, start GNAT Studio (it is provided with QGen Debugger at
$QGEN_INSTALL/libexec/qgen/bin/gnatstudio[.exe]) and open the debugging project<MODEL_NAME>.gpr. To start debugging, there is no need to re-generate the code with QGen, simply start the debugger with Debug -> Initialize -> main in the top menu.When the model has changed:
The above standard procedure (Create a Debugging session from Simulink) applies. However, it may be a bit slow and tedious to do repeatedly.
An alternative, faster approach is to re-export the XMI manually in MATLAB using:
qgen_export_xmi ('<MODEL_NAME>', '-o', '<OUTPUT_DIR>')where
<OUTPUT_DIR>is the directory containing the exported XMI for the model. Then, start GNAT Studio independently, open the debugging project<MODEL_NAME>.gpr, re-generate the code from the new XMI and start debugging as described in Generating code and starting a debugging session.Note
This approach does not update the simulation results. If you are interested in updating the simulation results after changing the model, use the standard procedure in Create a Debugging session from Simulink.
5.3. Setting up manually a Simulink project with GNAT Studio
To be able to use the Model Debugger you need a minimal configuration in a .gpr file in your project directory. You must at least specify the following properties (we target the C language here but you can replace it with Ada without any additional difference):
project Project_Name is

  -- Simulink must be added to the list of Languages
  for Languages use ("C", "QGen");

  package Compiler is
    -- The target executable has to be compiled with debug infos
    -- -fpreserve-control-flow is recommended to make sure breakpoints
    -- are properly set before assignments execution
    for Switches ("C") use ("-g", "-fpreserve-control-flow");
  end Compiler;

  -- A main file calling the generated code top level init and comp routines
  for Main use ("main.c");
  for Source_Dirs use ("src", "generated");
  for Object_Dir use "obj";

  -- All the qgenc options are specified within this package
  package QGen is

    -- Generated files are generated inside the following directory
    for Output_Dir use "generated";

    -- The Target property specifies model that have to get their code
    -- generated for a given target
    for Target ("main.c") use ("my_model.xmi");

    -- We target the c language, the --debug option is not mandatory
    -- but disables optimization to provide better traceability between
    -- the model and the generated code
    for Switches ("my_model.xmi") use ("--debug", "-l", "c",
                  "--pre-process-xmi",
                  "--gen-entrypoint");
  end QGen;

end Project_Name;
The project directory corresponding to the previous gpr file will be:
./
./project_name.gpr
./generated/
./obj/
./model.slx
./src/
./src/main.c
A project file generated by creating a debug session from MATLAB will contain a Debug_Args attribute in the QGen package, it is used to store the mandatory arguments for the framework to start correctly.
When launching {GNAT Studio|GPS} you can then load the project with Project > Open and browse to the project_name.gpr file.
You can find a working project file example in the QGen examples called
speedometer/speedometer.gpr. You can open the project with GNAT Studio and
start a debugging session by following the sections below.
5.4. Generating code and starting a debugging session
Once the project is successfully loaded inside GNAT Studio you should see the following icons:

The left one will generate code using qgenc and the options specified inside the project file and then compile the executable using the generated code and any additional source file provided by the project file.
The right icon will compile like the left one but will also start a debugging session.
If you do not wish to generate code, but still need to build your executable and/or debug the model you can use the GNAT Sutdio menus Build > Project > Build all and Debug > Initialize > [project_name] > main.[c|adb].
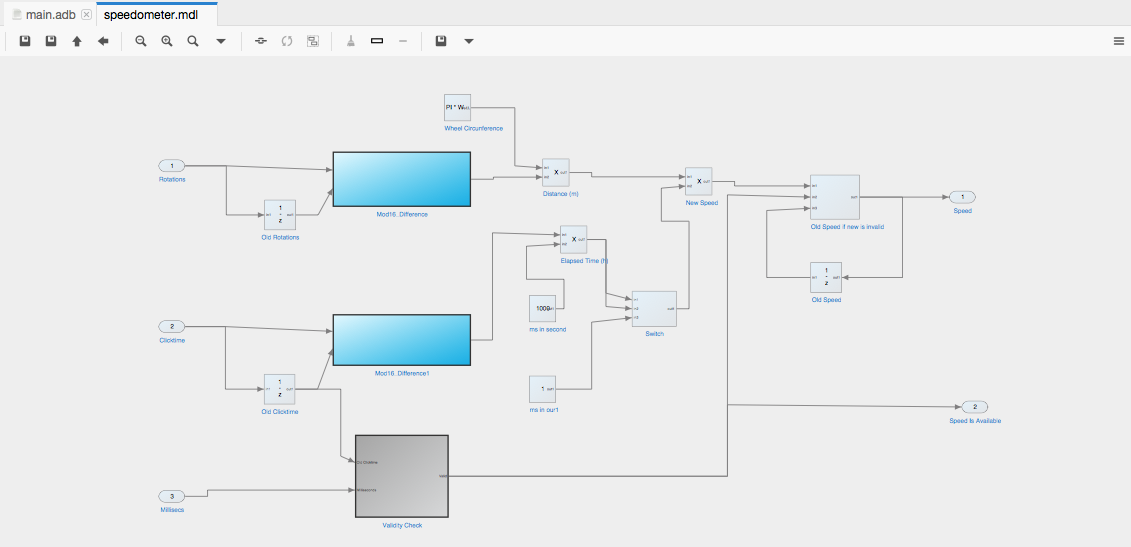
If you open the model by double cliking on it gps will load it and open it in a new view, displaying all the blocks and signals (cf. image below)
5.4.1. Editing QGen code generation options
To edit the options that QGen uses for code generation, there are two options:
5.4.1.1. Graphically
In the Project View, right-click on the XMI file that corresponds to
the top-level model of the project (e.g. speedometer.xmi), then click on
Edit switches for speedometer.xmi.
A configuration dialog will open. You may select options graphically or edit the command-line at the bottom. Clicking on Save will apply those switches to the XMI file and automatically update the project.
5.4.1.2. Editing the project source file
Alternatively, you may open the project source file and edit it. Right-click on the project in the Project View, Project -> Edit source file, then edit the following line to use the desired code generation options:
for Switches ("speedometer.xmi") use ("--debug", "-l", "c", "--pre-process-xmi", "--gen-entrypoint");
Do not forget to reload the project after saving the file.
5.5. QGen Debugger features
Once the debugger has started you can right click in the model view to display a contextual menu giving you access to the model debugging features.
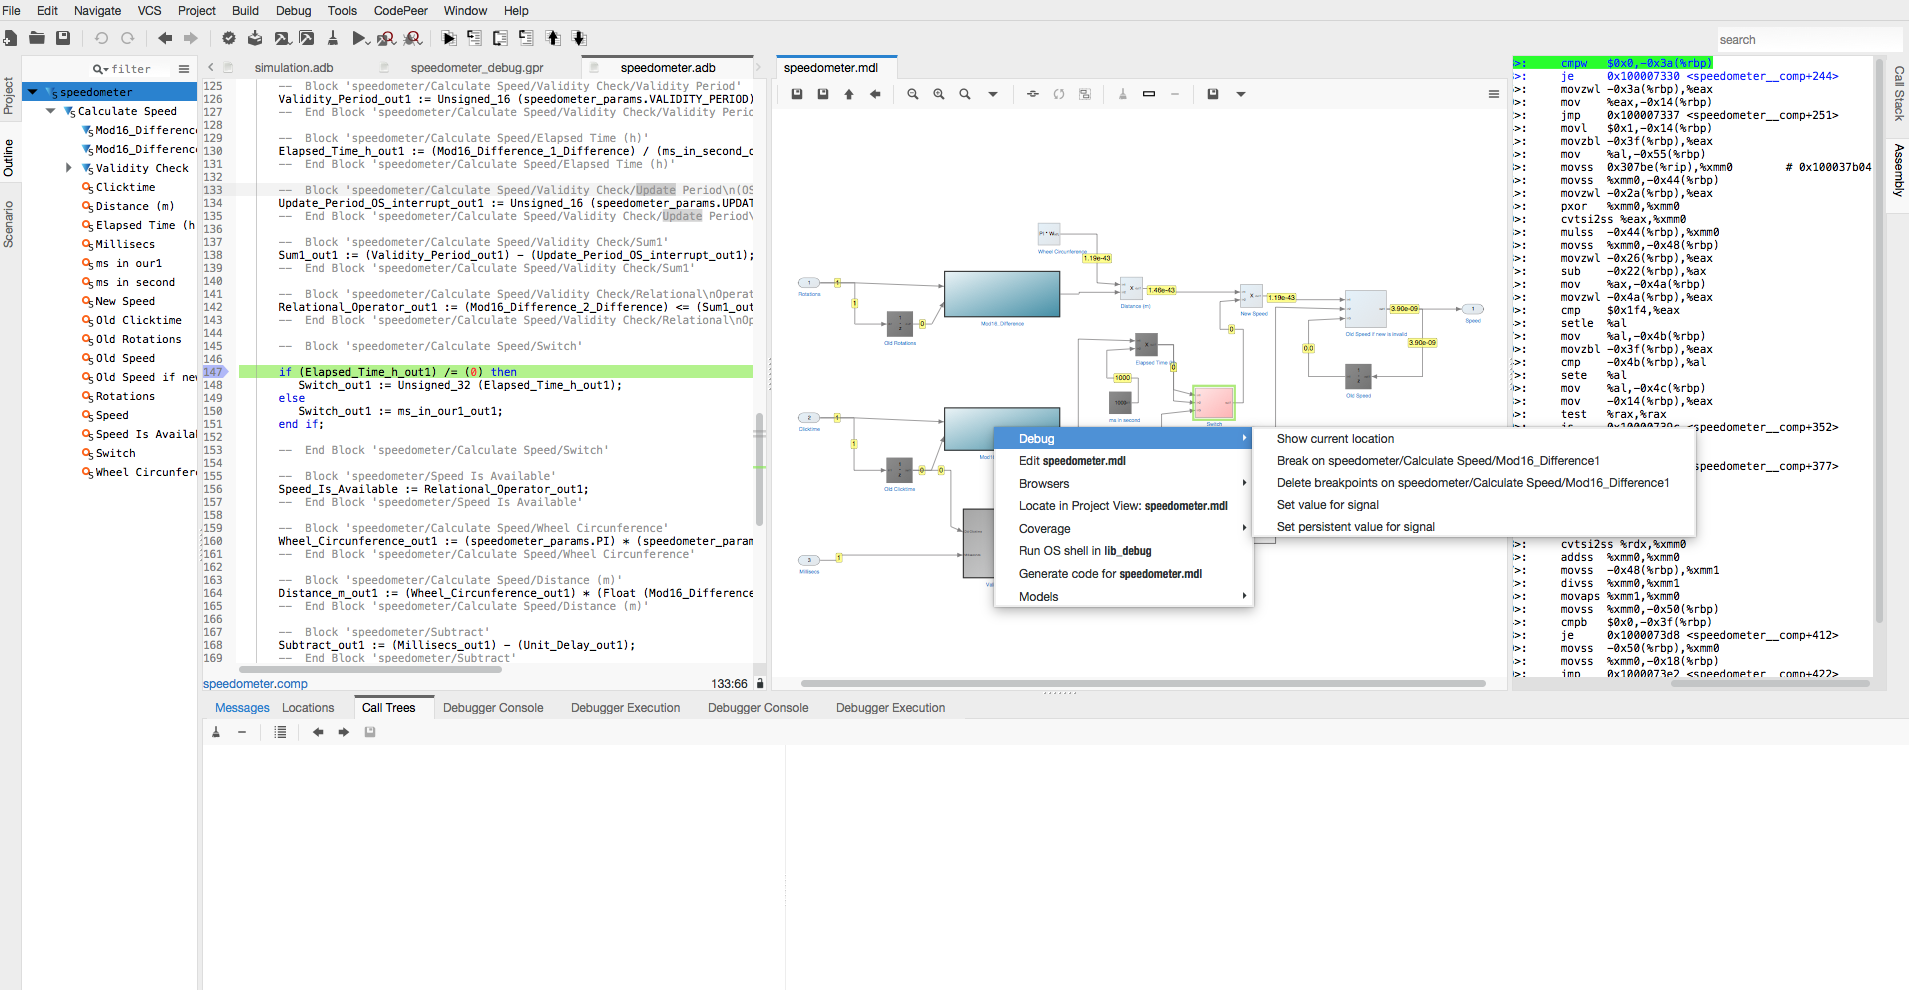
In the contextual menu hover on the Debug submenu to choose between the
following options during debugging session
Show the current execution pointer in the source code
Set/Delete a breakpoint on the block (the corresponding breakpoints will be set or deleted inside the generated source code at the lines corresponding to the chosen block).
Change the value of a signal to alter the corresponding variable value in the code by clicking on
Set Value for signal. This is really valuable to force a model to reach a certain stage and test it with a variety of values. You can force a signal to stay at a given value by checking thePeristentbox and enter the desired value in the dialog box. This will preserve the value set over the program iterations to force specific cases to happen, which is a powerful way to test behaviours that are difficult to construct from the top level inputs.In the
Modelssubmenu theShow source codeaction will show the block corresponding source code in the generated source file.
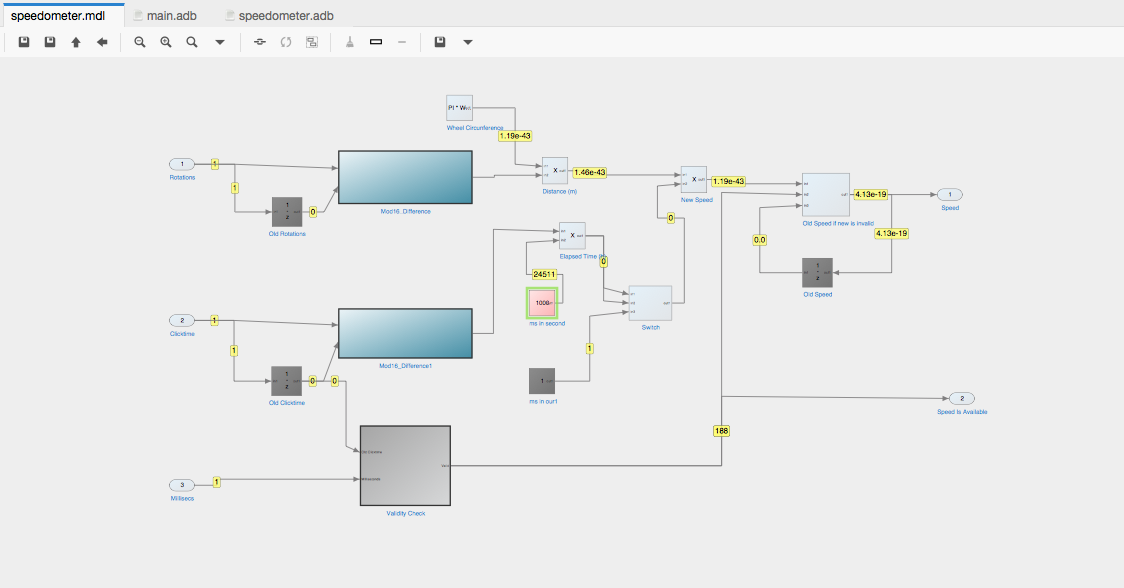
During the execution the model view is also updated to show the current block under execution with a green outline, and the value for all the signals in the current subsystem. Some signal values will not be up to date at some point during the execution but you can refer to the source code to find out where this is the case.
You can navigate between subsystems by double clicking on a subsystem or using the Uparrow and LeftArrow buttons above the diagram to navigate to the parent or previous subsystem respectively. The model hierarchy is also represented in the outline panel when the diagram is under focus, and you can click on a subsystem to visit it. All current blocks from the current subsystem are also listed in the outline panel, clicking on a block will highlight item.
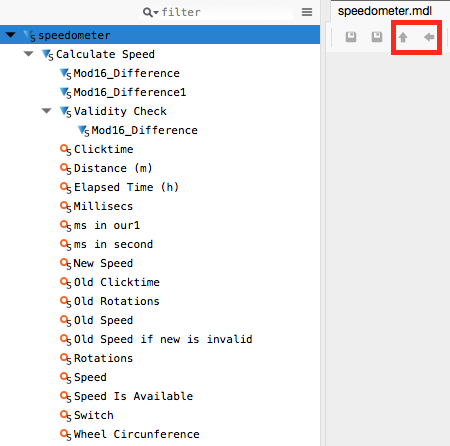
All signals values are updated when the displayed subsystem changes.
5.5.1. QGen Debugger constraints
5.5.1.1. Stateflow charts
QGen Debugger only displays Stateflow Chart Blocks. They cannot be opened to display their internal events, states or transitions, and the debugging support is limited to setting breakpoints on the entry point of a chart.
5.6. Advanced usage
5.6.1. Use a separate compiler/debugger/{GNAT Studio|GPS} version
You might be interested in using a different version of the tools packaged with the QGen Debugger. This is possible but please be aware that some features of the debugger might not work with older versions of the tools.
To specify which tools to use when launching {GNAT Studio|GPS} and the QGen debugger from MATLAB you must edit the file etc/qgen_tools.env in the QGen installation path. You can either add each necessary environment variable manually or on Unix*, simply run env >> etc/qgen_tools.env from your terminal.
To change the compiler/debugger within {GNAT Studio|GPS} go to Build > Settings > Toolchains and edit the Compiler path and Tools path as necessary.