Code Visualizer for Visual Studio Code
The Ada & SPARK VS Code extension provides commands to display code information as interactive graphs using Language Server Protocol (LSP) requests.
Features
The extension uses LSP to collect data for graphs, which means it works with any language that has a Language Server connected to VS Code.
Note: Language Servers implement the Language Server Protocol differently, so some features may not work perfectly for all languages. The extension is designed to work with most languages.
To address these differences, you can add language-specific features.
Graph Types
All the different commands display interactive graphs. Several types of graphs are available:
Call Graph
The Call Graph shows the relationships between function calls in your project.
How to use:
Right-click on a function symbol
Select
Show Call Hierarchy (graph)
This opens a new tab with an interactive graph. You can move nodes around and use the features described below.
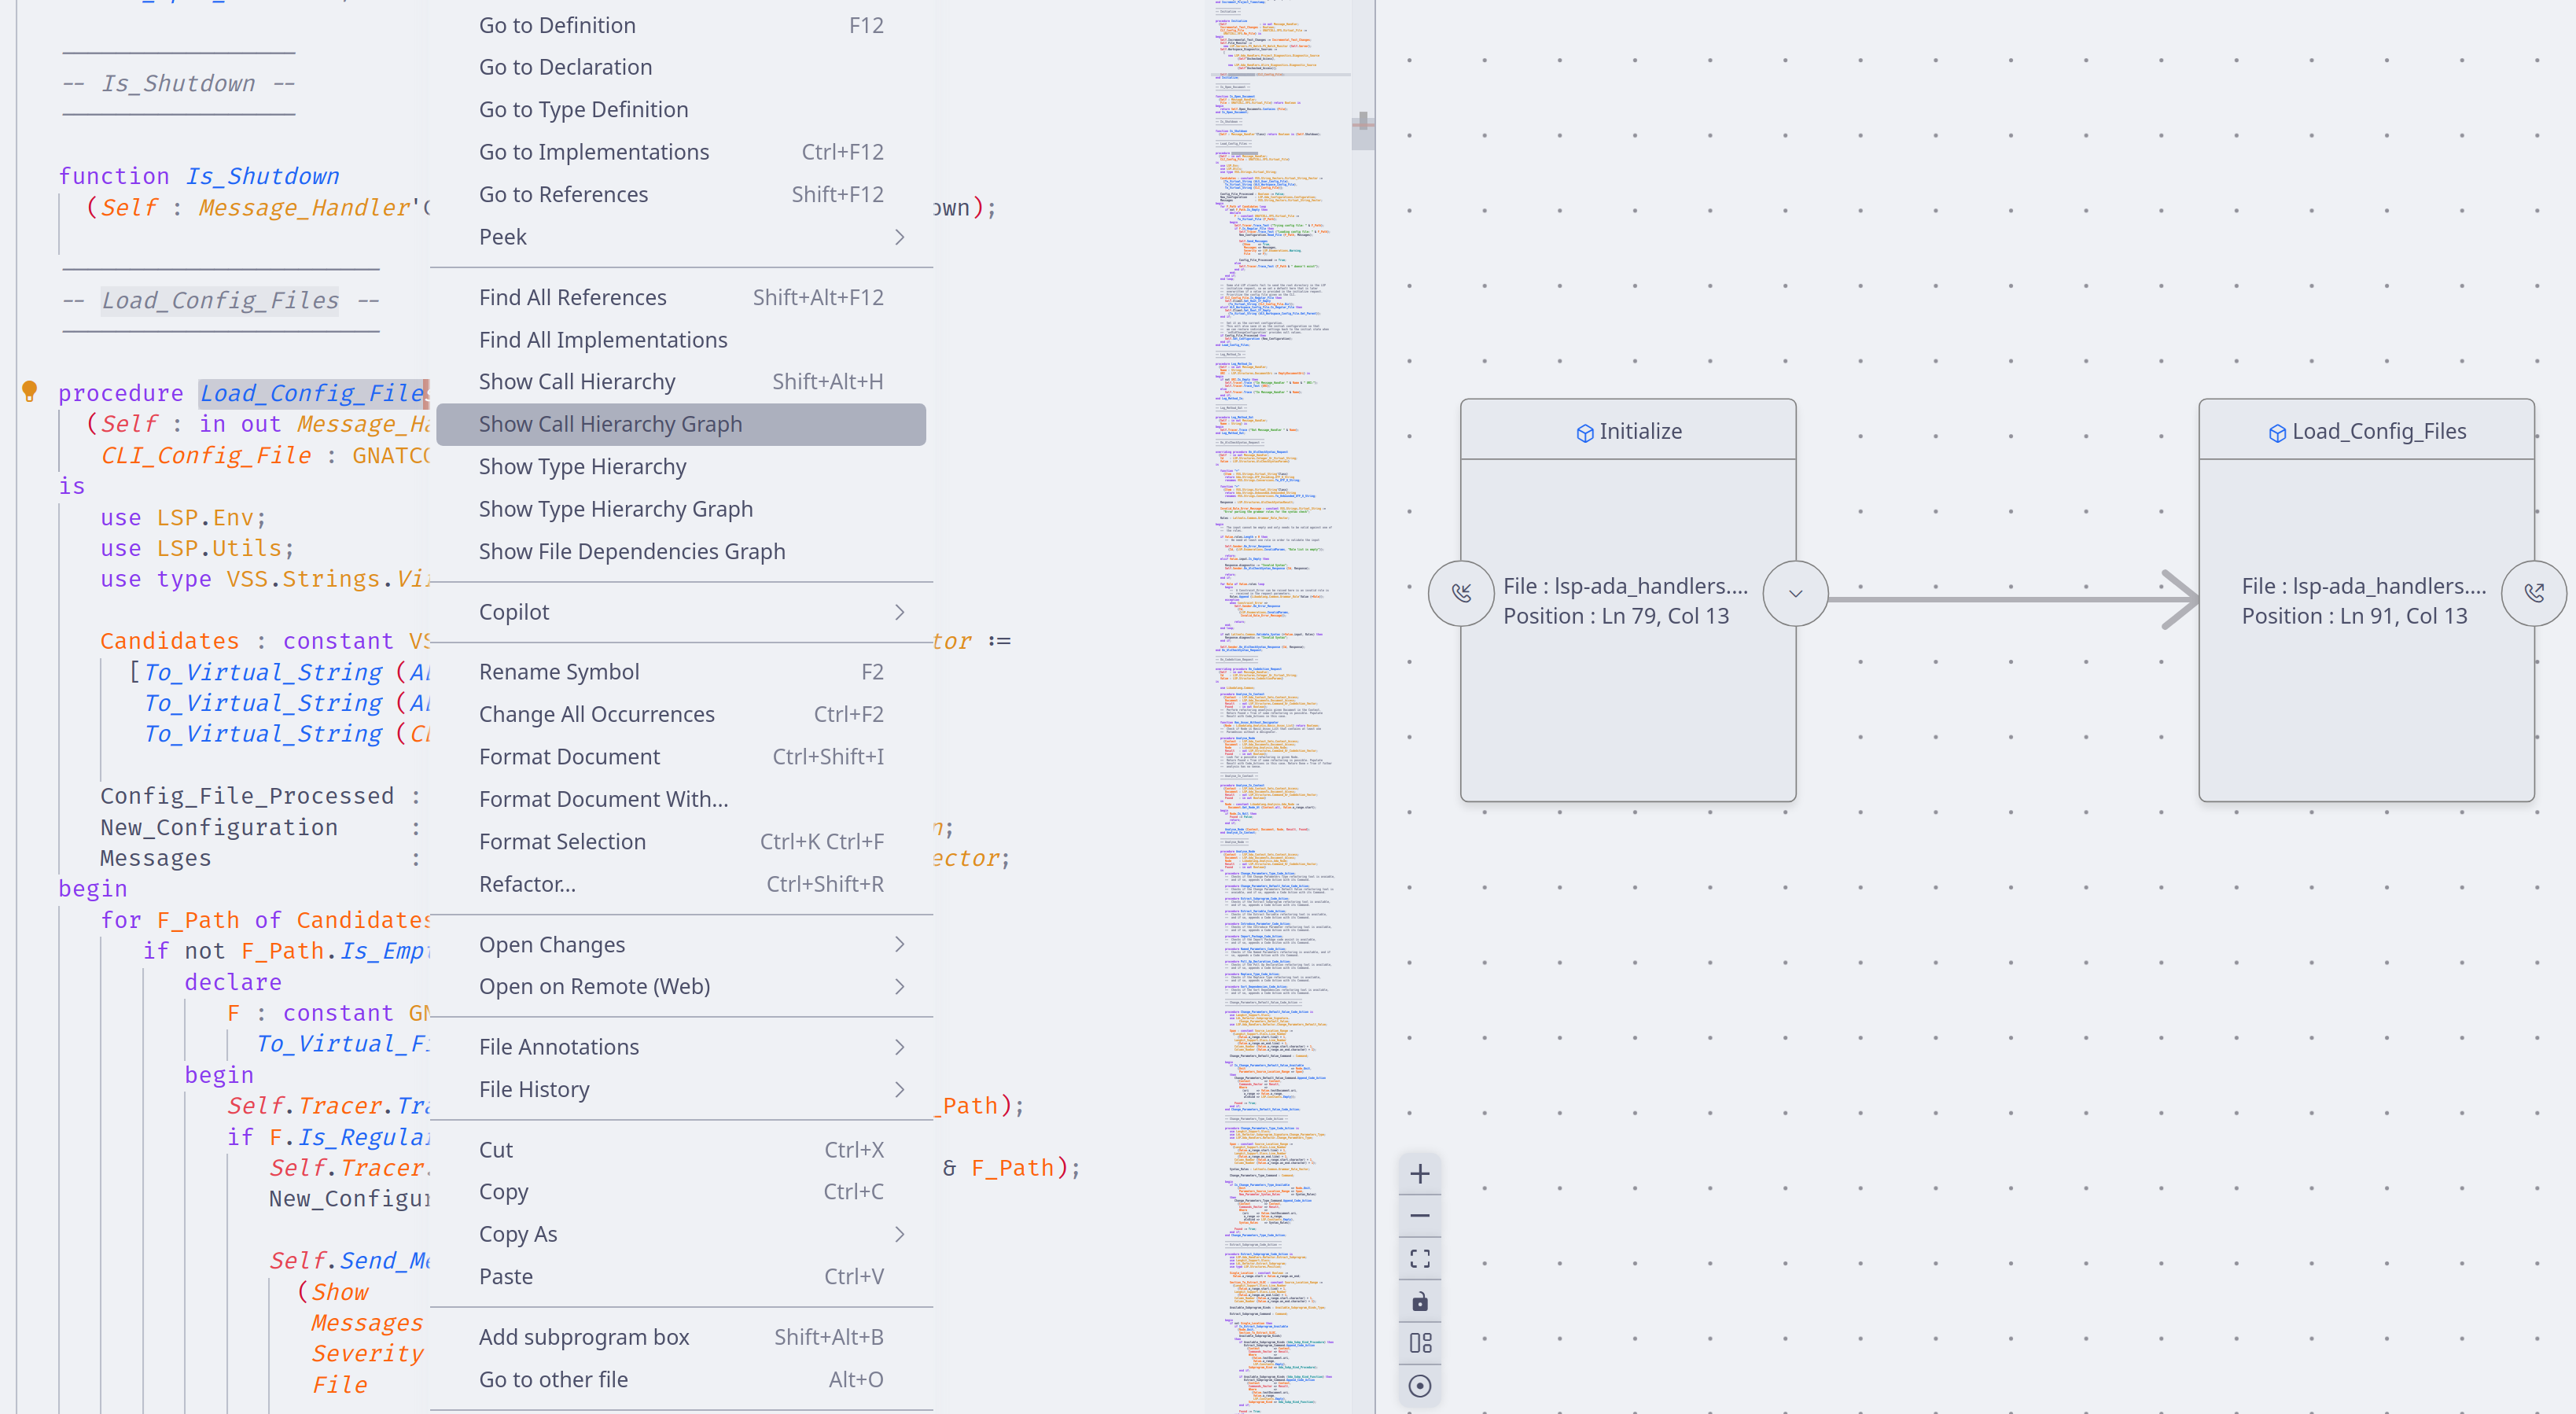
In this example, the graph starts from the Load_Config_Files function and shows an Initialize node, which is a parent (meaning Initialize calls Load_Config_Files).
Type Graph
The Type Graph shows hierarchies between different types in your project.
How to use:
Right-click on a type symbol
Select
Show Type Hierarchy (graph)
File Dependency Graph (Ada)
Some graph types are language-specific. For Ada files, you can:
Right-click anywhere in the editor
Select
Show File Dependency (graph)
This creates a graph showing relationships between Ada files.
GPR Dependency Graph (GPR)
For GPR files, you can visualize relationships between GPR files:
Click anywhere in a GPR file
Select
Show GPR Dependency (graph)
The graph uses different visual styles:
Dotted edges: Imported projects
Solid edges: Extended projects
Sub-graphs: Aggregated projects are shown as containers with their aggregated projects inside
Expanding the Graph
To avoid performance issues, graphs initially show only the main symbols and their direct connections. You can expand the graph by:
Single expansion: Click buttons on each node to show parents or children
Recursive expansion: Hold the
Controlkey while clicking to expand multiple levels at once
During recursive expansion, you’ll see the graph grow in real-time. You can stop this process by clicking the cancel notification.
Folding Nodes
Once a node has children, you can:
Fold: Hide the children by clicking the fold button
Unfold: Show hidden children again by clicking the same button
Automatic Layout
When you add nodes, the graph automatically rearranges itself to keep everything visible and well-organized. If parts of the graph are disconnected, only the modified section is re-arranged.
You can also manually trigger layout changes using the Layout Graph button (bottom left), which also toggles between horizontal and vertical orientations.
Search Functionality
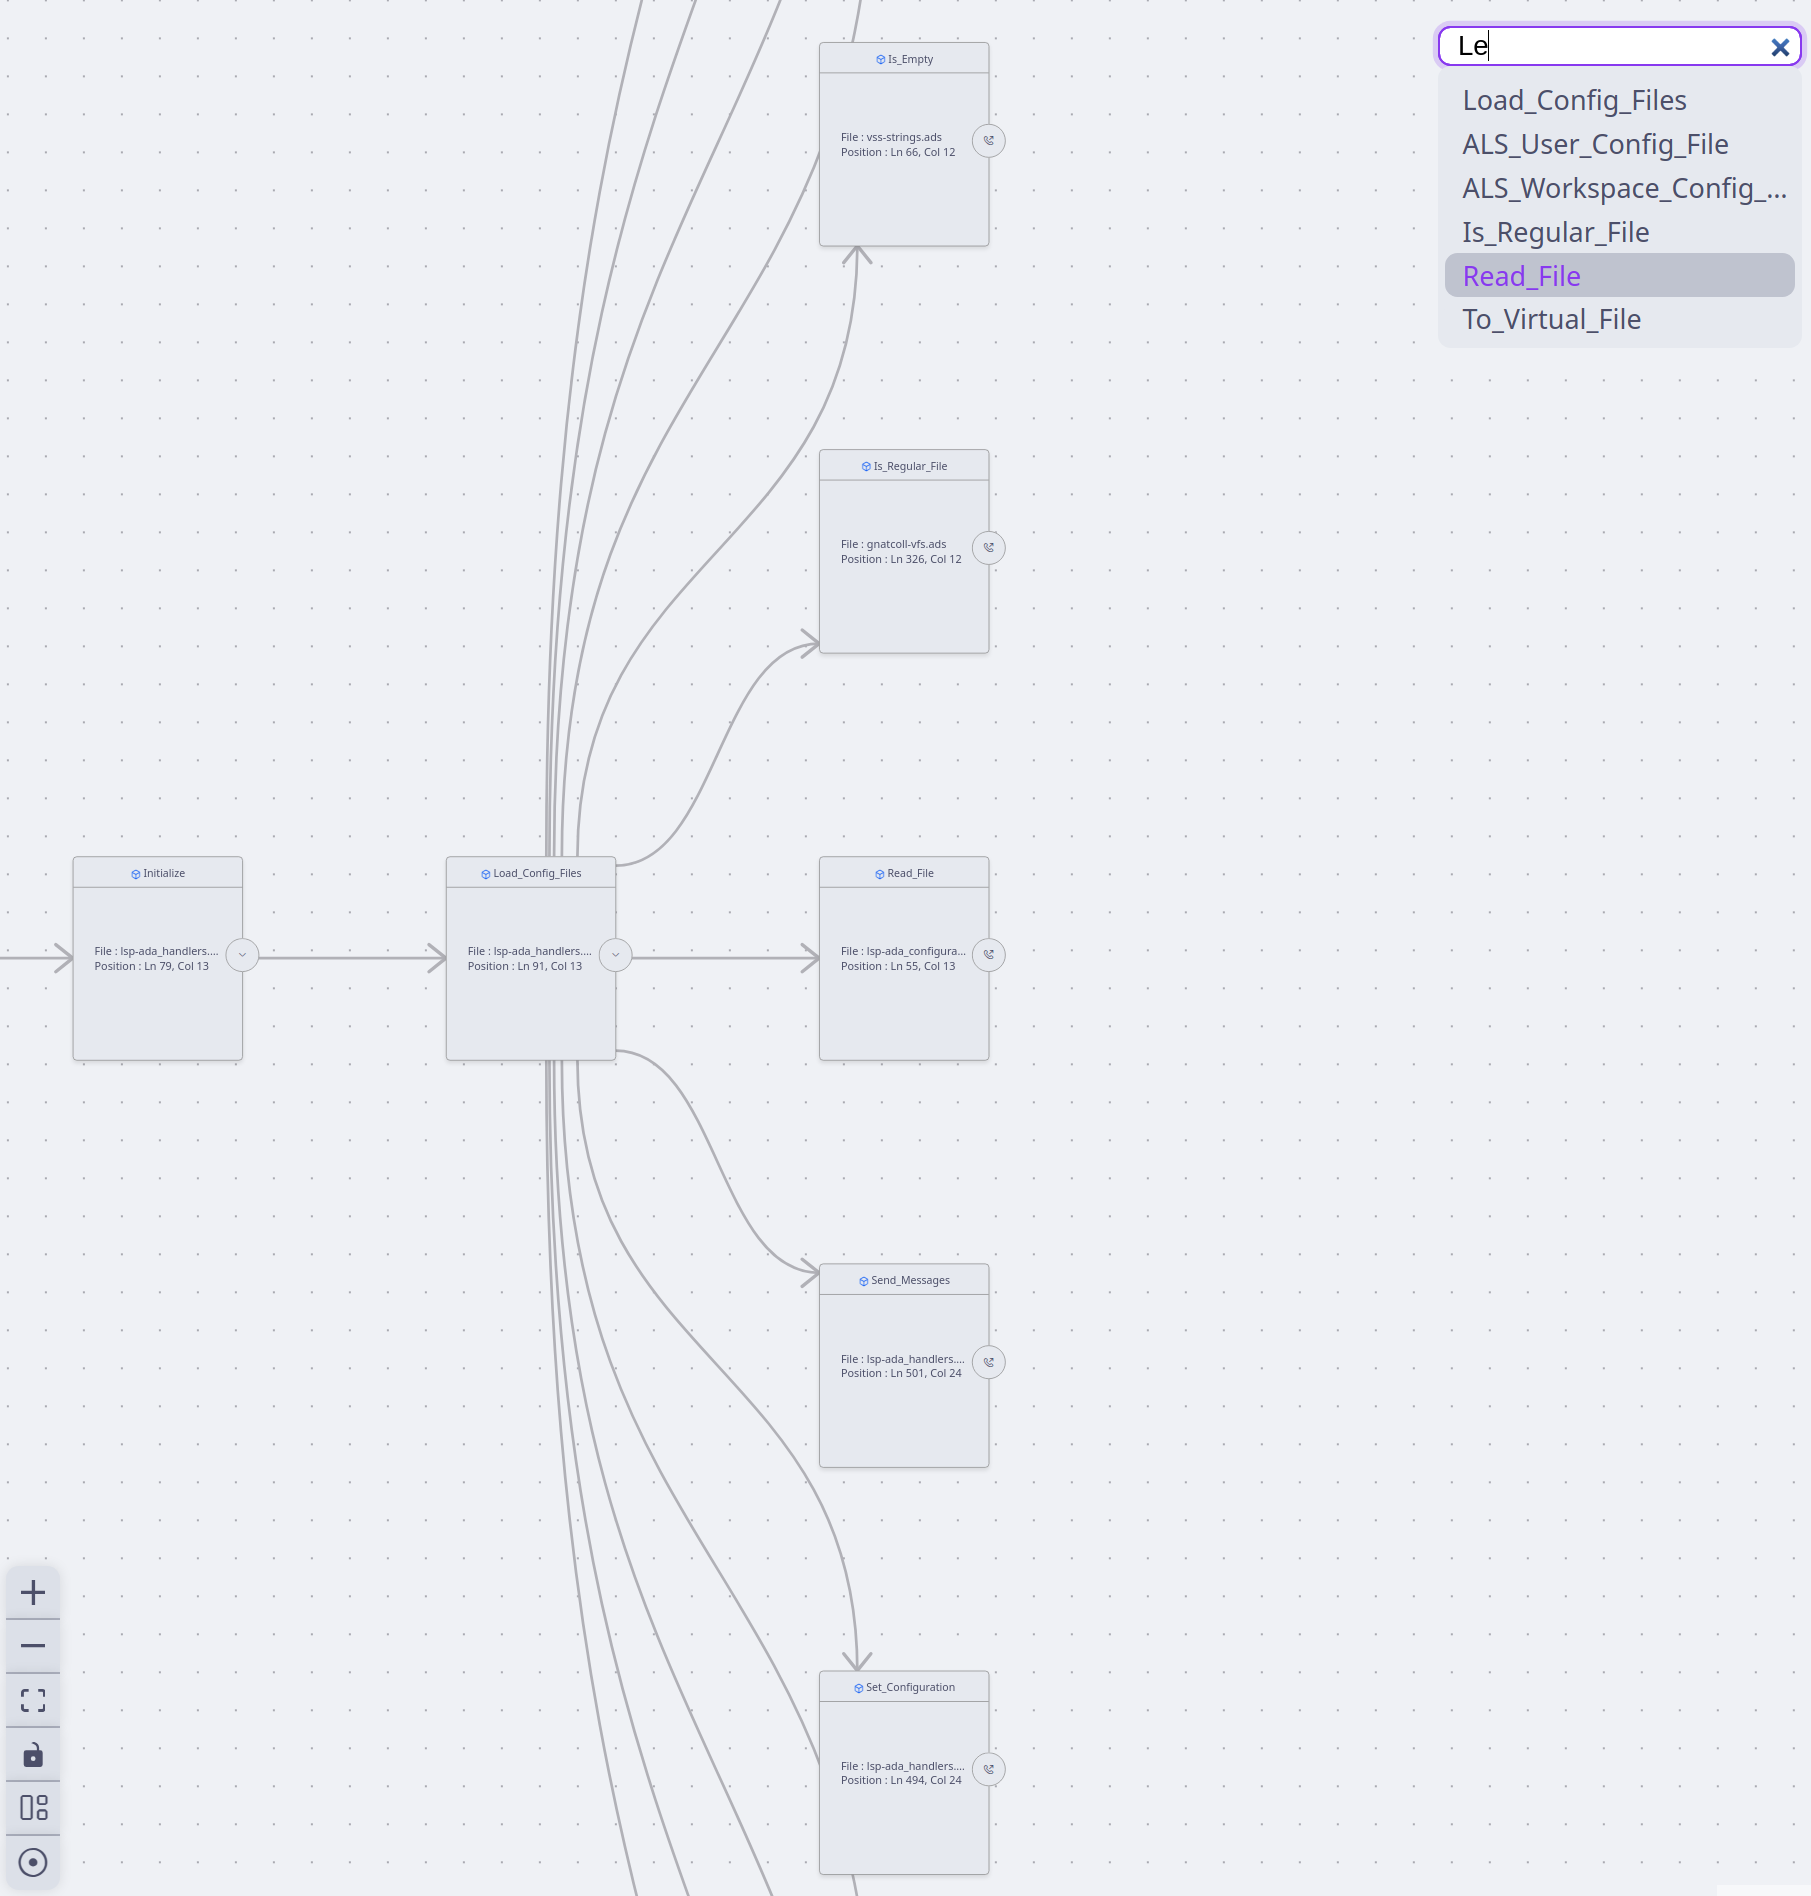
As graphs grow larger, finding specific nodes becomes difficult. The search bar (top right corner) helps you locate nodes by name.
How to use:
Type characters in the search bar
A list of matching node names appears
Navigate with arrow keys or
TabThe graph automatically focuses on the highlighted node
Press
Enteror click outside to close the search
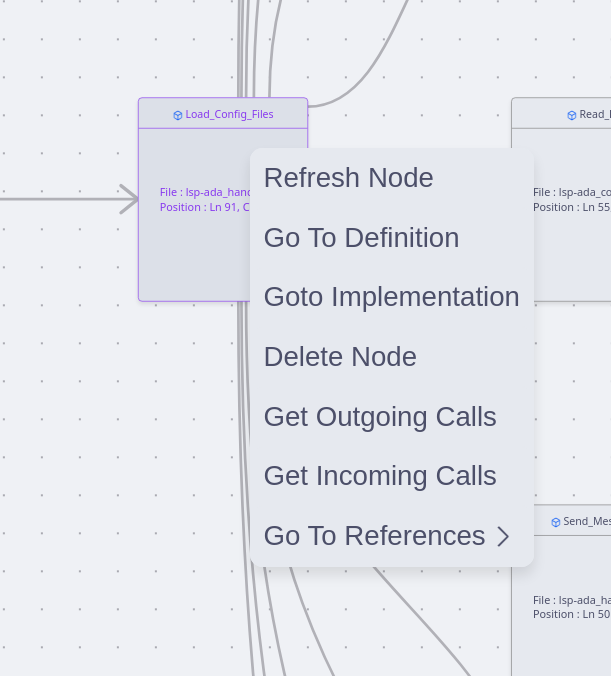
Node Context Menu
Right-clicking on any node opens a menu with these options:
Refresh node: Update the node’s information
Go To Definition: Jump to where the symbol is defined
Go To Implementation: Jump to the symbol’s implementation
Delete Node: Remove the node from the graph
Get Parents (the actual label differs depending on the feature): Add parent nodes (e.g: outgoing calls for Call Graphs)
Get Children (the actual label differs depending on the feature): Add child nodes (e.g: incoming calls for Call Graphs)
Go To References: List and navigate to all references of the symbol
Selecting Nodes
You can select nodes in multiple ways:
Single selection: Click on a node
Multiple selection: Hold
Controland click multiple nodesArea selection: Hold
Shiftand drag to select a region
Deleting Nodes
Remove nodes from the graph using:
Select nodes and press
BackspaceorDeleteRecursive deletion: Hold
Controlwhile deleting to also remove all children
Note: In circular references (A → B → C → A), recursive deletion only removes nodes that aren’t parents of the deleted node.
Refreshing Nodes
When you modify code while the graph is open, some symbols may move, making nodes invalid.
Solution: Right-click on affected nodes and select Refresh Node from the context menu.
Important: This tool is designed for code visualization and understanding, not active development. Making extensive code changes while the graph is open may invalidate many nodes.
Navigating to Code
The graph provides several ways to jump to related code:
Go To Definition
Double-click on a node (or use context menu)
Opens the symbol’s definition in an editor
If already open, focuses on the correct position
If not open, opens in a column next to the graph
Go To Implementation
Control + double-click on a node (or use context menu)
Jumps to the symbol’s implementation
Go To References
Two ways to access references:
Edge references: Hover or click on an edge between nodes
Shows a popup with references in the specific context
Example: Edge from
BartoFooshows all calls toFoowithinBar
All references: Use the context menu on a node
Shows all references to the symbol across the codebase
Organized by function name and file location
Navigation: Use arrow keys or Tab to move through the list, then press Enter to jump to a reference. You can also click directly on list items.
As you navigate the list, the relevant code appears in a side panel, giving you context about each reference.
Note: This feature works for Call Graphs and Type Graphs only, as GPR and File graphs don’t have meaningful references.
External Nodes
Sometimes LSP requests return symbols from external libraries (standard library, shared libraries, etc.) rather than your project code.
These external nodes are displayed with:
Different colors from regular project nodes
Dotted borders to indicate they’re external
Limitation: External symbols may not have complete information, so some features might not work properly with these nodes.
Multi-Language Support
This extension aims to work with any language that has a Language Server implementation.
However, each Language Server implements features differently, and each language has unique characteristics not covered by standard LSP requests.
Solution: The extension provides a generic interface with implementations that work for most languages. These can be customized for specific languages through sub-classes.
Example: The generic interface provides Call Graphs and Type Graphs for all languages, but the Ada-specific implementation adds the File Dependency Graph feature.