Using GNATcoverage from GNAT Studio
Attention
Support for coverage of non-instrumented programs (i.e. Binary Traces) is deprecated and will disappear after GNATcoverage 26 releases. You are encouraged to migrate to instrumentation-based coverage, see Producing source traces with gnatcov instrument for more information.
Starting from GNATcoverage version 22.0, binary traces (using gnatcov run) are no longer supported in native profiles. This mode is still supported for cross configurations, and the IDE integrated use in such cases is similar to the use for source traces:
Go to the
menu to perform each step individually, or use the Run All Actions item to
do everything at once.
In configurations where binary traces are not supported, the menu entry just wouldn’t show up.
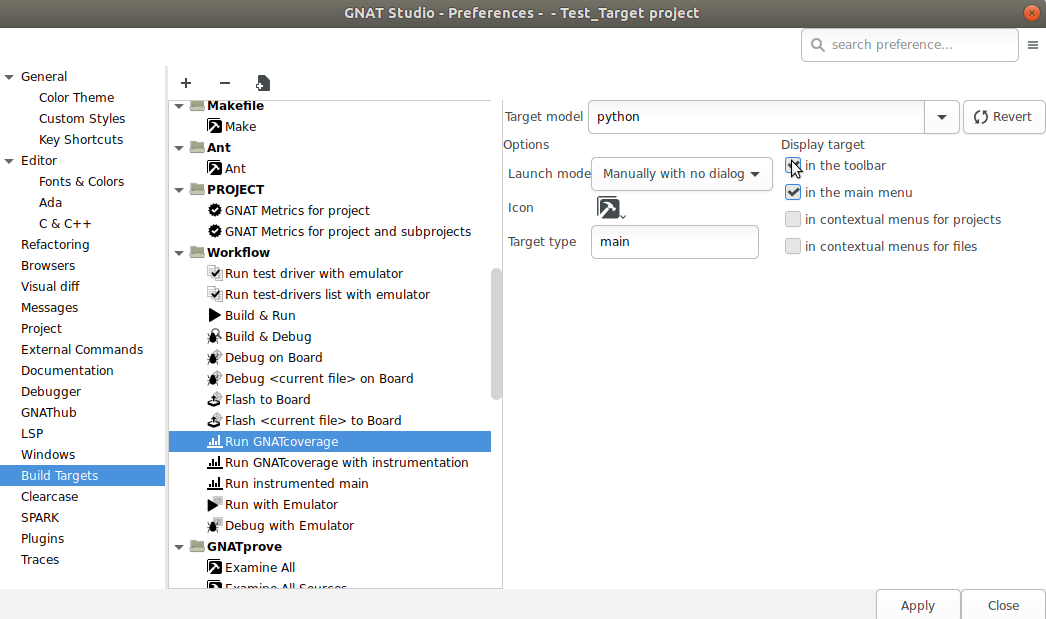
You can also replace the toolbar button (dedicated to the instrumentation-based scheme) with an alike button, but for binary traces. Go to GNATstudio Preferences in .
Then, go to the Build Targets section, and find the Run GNATcoverage
workflow: add it to the toolbar as shown below.
Remove the Run GNATcoverage with instrumentation entry from the toolbar in
the same fashion.