Introduction
Definition and main characteristics
Unlike source traces produced by the execution of instrumented programs in their regular environment, binary traces are coverage trace files produced by the execution of uninstrumented programs under the control of an instrumented execution environment. “Binary” in this designation refers to the nature of the collected data, which consists in low level information about executed blocks of machine instructions.
From binary traces, GNATcoverage is able to compute both source coverage metrics as with source traces, and object coverage metrics assessing the coverage of machine level instructions. GNATcoverage supports two criteria of the latter kind:
Instruction Coverage, where we evaluate for each machine instruction whether it has been executed at least once or not; and
Branch Coverage, where we also evaluate for each conditional branch instruction whether it was only taken, or went fall-through, or both.
Source coverage metrics are only available for a subset of the target configurations supported with source traces, though, and new tool functionalities are most often implemented for source traces only.
The matrix below summarizes the main characteristics of the two trace production modes:
With Source Traces |
With Binary Traces |
|
|---|---|---|
Tracing mechanism |
Program instrumentation |
Execution environment |
~ |
~ |
~ |
Native applications |
Yes (including shared-libraries) |
No |
Cross configurations with RTOS |
Yes |
No |
Bare metal configurations |
Yes |
Specific CPUs only, through GNATemulator or hardware probes |
~ |
~ |
~ |
Object coverage analysis |
No |
Yes |
New features |
Often not |
Yes (source level metrics for C++, scoped metrics in html) |
Workflow overview
A high level view comparing the processes involved in the use of binary or source traces is provided on Fig. 1. The use of coverage traces in both modes allows lots of similarities between workflows, in particular in the steps processing traces after they have been produced.
We don’t support mixing the two kinds of traces together, though, and have depicted a separate analysis/consolidation step to emphasize this:
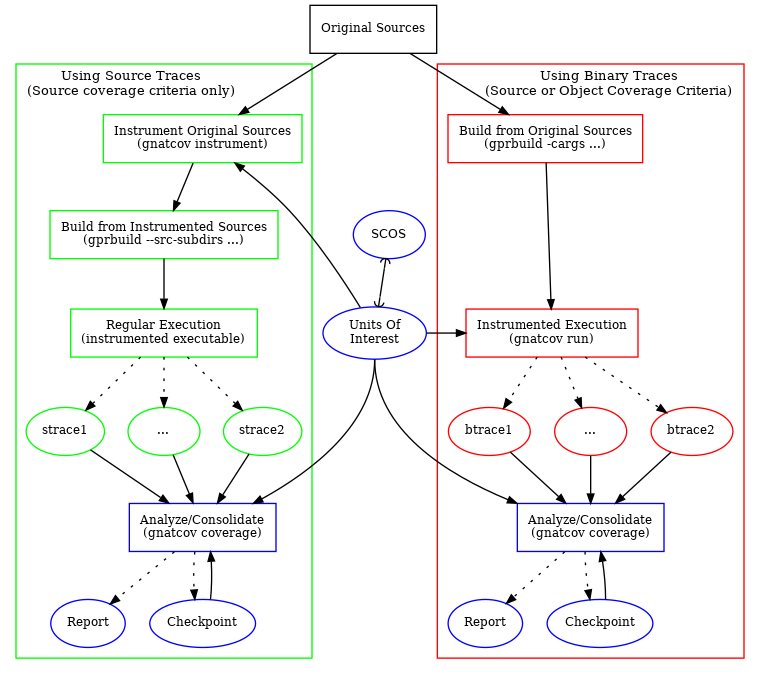
Fig. 1 Workflows using source or binary coverage traces
For binary traces, gnatcov relies on an instrumented execution environment to produce the traces instead of having to instrument the program itself with extra code and data structures. GNATemulator provides such an environment for bare metal configurations, as well as hardware probes assisted with means to convert their output to the format gnatcov expects.
Programs are built from their original sources, only requiring the use of
-g -fpreserve-control-flow -fdump-scos compilation options to
generate coverage obligation lists and let us associate execution traces to
these obligations afterwards.
A simple example
For the original “Getting Started” use case, we first use the GNAT Pro
toolset for powerpc-elf to build, using gprbuild as
follows:
gprbuild --target=powerpc-elf --RTS=light-mpc8641 -Ptests.gpr \
  -cargs -g -fpreserve-control-flow -fdump-scos
We pass the project file with -P, the required compilation flags
with -cargs and request the use of a light runtime library tailored
for the mpc8641 board.
The build command produces a test_inc executable in the object
subdirectory. To automate the execution of this program within GNATemulator
to produce a trace, we provide the gnatcov run command. For the use case
at hand, we would simply do:
gnatcov run --target=powerpc-elf obj-tests/test_inc
This produces a test_inc.trace binary trace file in the current
directory. By default, such a trace is amenable to statement and decision
coverage at most. If MCDC analysis is needed, --level=stmt+mcdc must be
passed to gnatcov run as well and we recommend also providing source coverage
obligations in this case.
Producing report is then achieved as for sources traces, using the binary trace files as inputs to the gnatcov coverage commands.
Units of interest can be conveyed with either the GPR oriented
facilities as with source traces, or with --scos
switches to provide lists of files holding coverage obligations in a
similar fashion as --sid switches for .sid files out
of source instrumentation.
The files to list with --scos are the Library
Information files produced by the compiler along with object files,
which are .ali files for Ada and .gli files for C.
The GNAT toolchain provides a helpful device in this process for Ada
units: the -A command line argument to
gnatbind which produces a list of all the .ali files
involved in an executable construction. By default, the list goes to
standard output. It may be directed to a file on request with
-A=<list-filename>, and users may of course filter this
list as they see fit depending on their analysis purposes.
Below is a complete example sequence of commands to illustrate, using
the standard Unix grep tool to filter out test harness units:
# Build executable and produce the corresponding list of ALI files. Pass
# -A to gnatbind through gprbuild -bargs then filter out the test units:
gprbuild -p --target=powerpc-elf --RTS=light-mpc8641 -Ptests.gpr
  -cargs -fdump-scos -g -fpreserve-control-flow -bargs -A=all.alis

# Run and analyze all units except the test harness, filtering out
# the correspond ALI files from the list:
grep -v 'test_[^/]*.ali' all.alis > nontest.alis
gnatcov run --level=stmt+mcdc --scos=@nontest.alis
gnatcov coverage --level=stmt+mcdc --annotate=xcov --scos=@nontest.alis
Going Further
As the source and binary trace based workflows share commonalities, a lot of information from the main documentation also applies to the use binary traces, such as
The use of project files to specify command switches or designate units of interest at analysis time,
Using coverage checkpoints or traces for consolidation,
Defining exemptions regions with pragmas for Ada. The support for other languages is not available for binary traces.
Then this appendix holds separate chapters dedicated to binary trace specific considerations: