1. WebUI: The GNATdashboard web interface
The GNATdashboard web interface provides a web-based user interface to display, explore and manage the data gathered by GNATdashboard. It works with GNAT SAS, GNATmetric and GNATcheck.
1.1. Quick Launch
To launch the web interface, you first need to create the web data files statically.
1.1.1. Creating the data files
- Gnathub: The creation is done by default when running Gnathub.
If you don’t want it to be created, use the --plugins switch.
gnathub -P<project>
- GNAT SAS: You need to use the
gnatsas report htmlcommand: gnatsas report html -P<project>
- GNAT SAS: You need to use the
1.2. Web Interface Overview
Let’s take a look at the following picture:

There are three parts in the view: Header, Filter and Content.
The Header and Filter parts are static. The content space will change depending on your navigation.
1.2.1. Header
It is composed of two navigations buttons (on the left side):
the Message Navigation button, that will lead to Message navigation content.
the Project Navigation button, that will lead to Project navigation content.
1.2.2. Filter
This part is collapsible by clicking on the arrow on the upper-right of the filter span.
It will allow you to filter the messages shown in all the views, by clicking on the different span. There are three states for a span:
activated: the color is bright. You can deactivate it by clicking.
deactivated: the color is transparent. You can activate it by clicking.
No occurrence: the number on the right is a 0.
There is some color code that you will retrieve on the content page:
the left border color representing the tool that reports the message
the background color (red, orange, yellow, green) for the message ranking.
1.2.3. Content
There are three different pages:
Message navigation
Project navigation
Source view
1.2.3.1. Message navigation
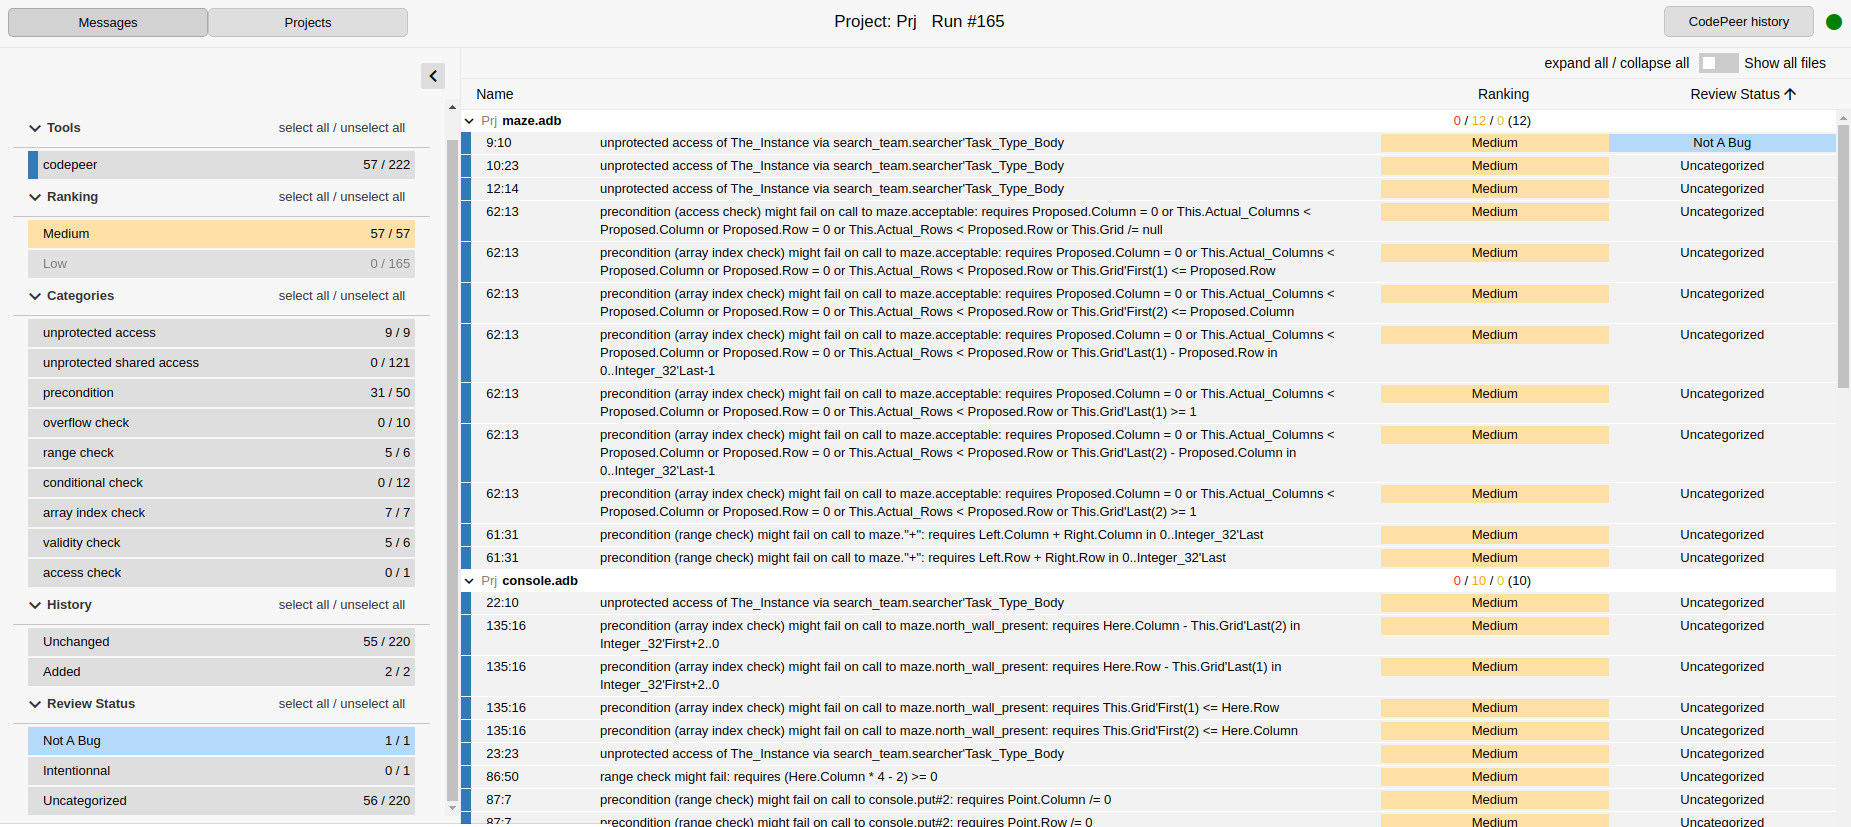
This part allows you to see all the messages, grouped by files.
You can order them by clicking on the table header (Name, Ranking, Message, Review status).
1.2.3.2. Project navigation
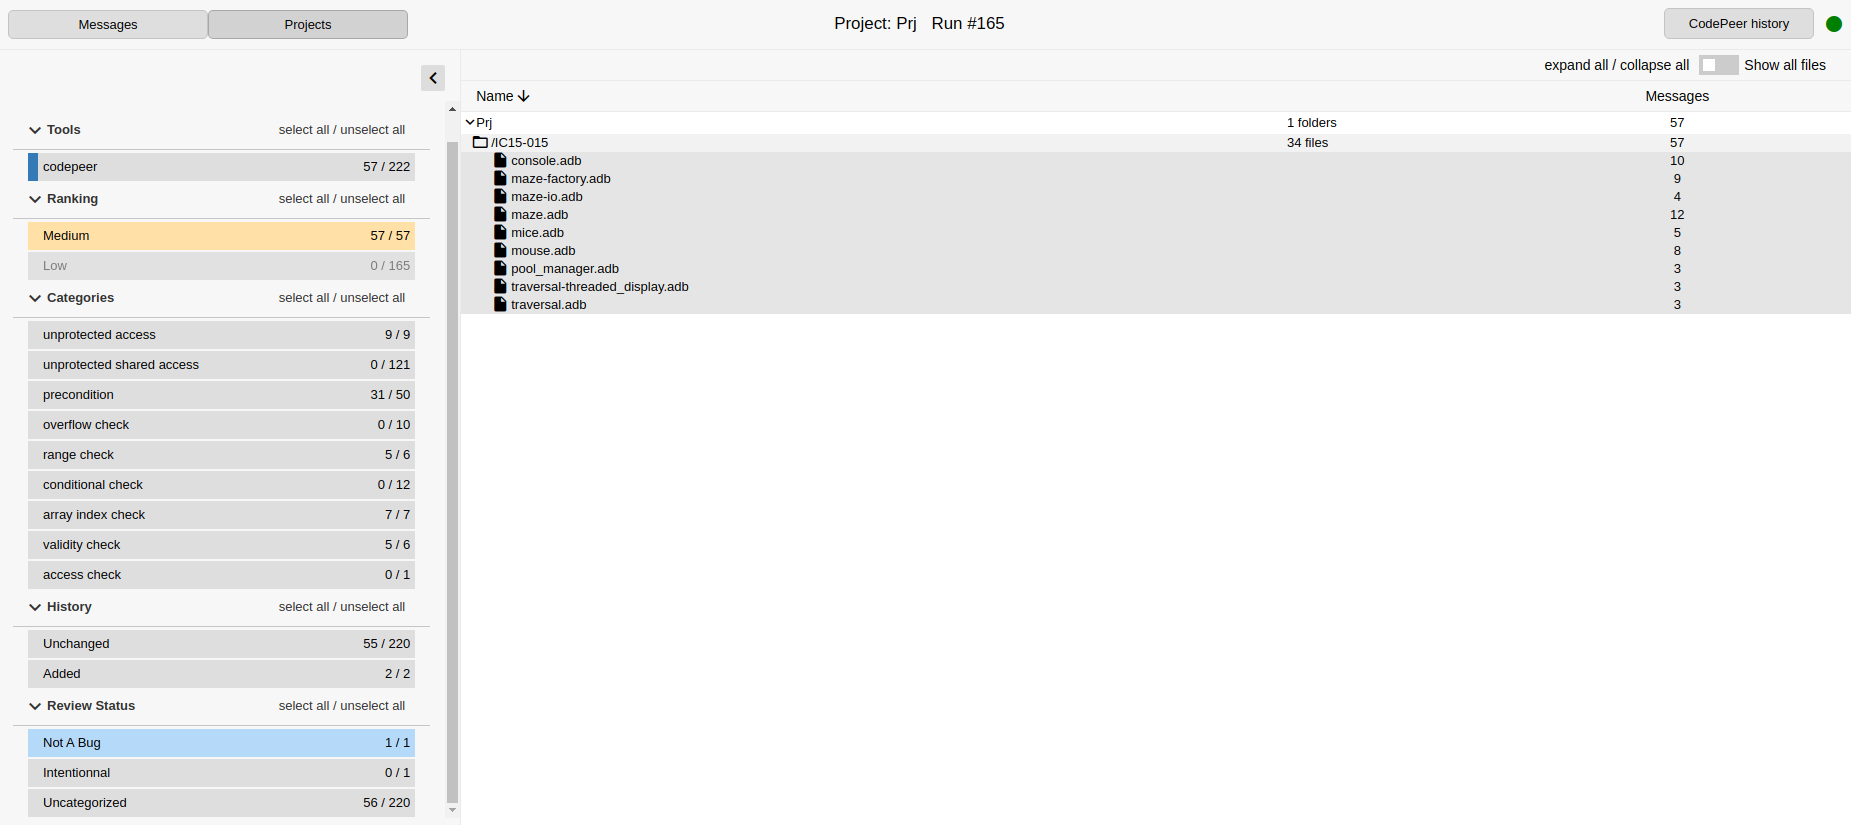
This part allows you to see all the files, grouped by folders, grouped by project. It is a very useful view when looking at a lot of projects.
You can order them by clicking on the table header (Name, Message).
1.2.3.3. Source view

This page is made of two parts:
the source file
the action bar
Source file
You can scroll through the source file. If the annotations in GNAT SAS are activated, you will see them in this part.
Action bar
This bar is collapsible.
File messages tab.You can see all the messages in the All messages tab.
line button, allow you to order message by line.If GNATmetric is activated, you can see them in the File Metric tab.
If there are Race condition, you can see them in the Race condition tab.
In the File message tab you can select a message by clicking on it. This will scroll the source view to the selected line.
If there are already some manual reviews made, then you can see the history icon appear, in the rightmost column.
By clicking on it, you will see the User review history pop-up open:

Note that WebUI used to allow adding reviews, but this functionality was removed in CodePeer 23. Refer to the GNAT SAS User’s Guide for more information on how to review messages with GNAT SAS.
1.3. Features shortcut
1.3.1. Filter messages
See the Filter section.